The AFM images all taken (including the cover image which had a micron estimate in the cover description — which was probably a little off since it was larger than the images in the actual manuscript by Arroyo et al. so that is disconcerting) still brings all images in this particular paper to a mean of just about 150nm diameter — (as measured by the diameter of a circle intersecting the majority of CRD at the periphery of the molecules (at least 3 in dodecamers and most in a fuzzyball). This is the same measure that was found previously. It seems painful to want these measurements to be precise, but it is necessary, in my opinion, to have a reasonable standard size to measure peak widths and distances along each of the trimeric arms.
Preliminary questions: What is being measured? roughness, rugosity, height, brightness? what constitutes a curve, what constitutes a peak, or a valley, or MOTIF (wikipedia defines this as “A motif consists of the portion of a profile between two peaks and the final combinations of these motifs eliminate ″insignificant″ peaks and retains ″significant″ ones,”, what is a mean line, and surface profile.
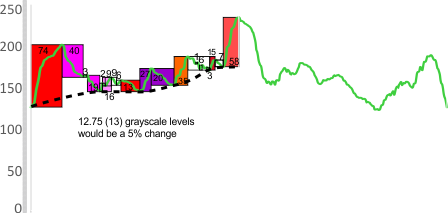
One of the problems of trying to analyze peak heights for AFM and TEM micrographs of large molecules is whether to put credence in the height of the peaks. Just using some proportion of the scale as a cut off, orange and red peaks are likely to be important, smaller peaks are not colored. This is HALF (that means one trimeric arm) of an surfactant associated protein D molecule image…. ImageJ used for LUT plot, half of the arm (one of the four) of a dodecamer. Only analysis of dozens of images will one be able to say whether there are three or four peaks between the N terminus and the CRD and in this case it looks like four. Another curve (that of the valleys — noted by the black dotted line) may not be a straight line.