Just a quick set of measurements from White et al shadowed dodecamer (TEM) and Arroyo et al AFM (many dodecamers measured) there is not a significant difference in the diameter or segmented line measurements of the SP-D arms. I will add other measurements. Even though the White et al is ratSP-D, and Arroyo et al is human SP-D, the former with a small deletion in C1 of SP-Ddel29–37 (according to White et al). What this deletion does to change the absolute arm length of rSPD is not known. Objective is to find a common diameter of SP-D, and arm length for each species and mutation set.
Monthly Archives: January 2020
Mini SP-D dodecamer size
Shadow cast image of mini dodecamers from White et al (Figure 3b – with their quote from Figure 1 -“MiniSP-D lacks two exons of internal collagen sequence
(C3–C4)”), measured for a comparative size – specifically because the CRDs in the mini SP-D dodecamers were significantly different size than those of the rSP-D in the same image and purportedly the same magnification (per this post) . 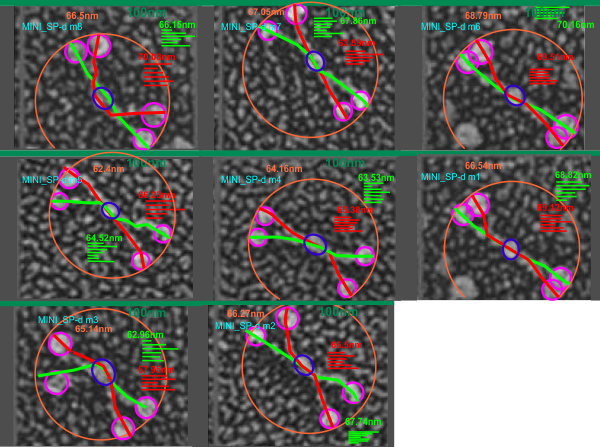
n=24, which includes segmented line measurements of each hexamer separately, and one measurement of diameter (touching the outer edge of at least three of the four dodecamer CRD. x=66.53 nm + 2.2
THIS IS IT: seeking for what is eternal
This is a quote from an interview with Leonard Cohen….. I love it…. so why is it necessary for us to disassociate our rational seeking the eternal from our acceptance of eternity?
“What happened to me was not that I got any answers, but that the questions dissolved.”
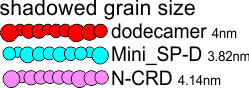
Size of Shadowed SP-D CRD
While the images in White et al, are nice, it has bothered me many times that the size of the shadow granules on the SP-D dodecamers in Figure 3A, and the CRD domains, look larger to me than those of B and C in the same figure. There is a bar marker of 100 nm in the top figure and while making micron bar markers is better than giving the magnification of the original micrograph as the only way to judge (measure) sizes of molecules, it seems to be fraught with error. Here the CRD in part C of the figure are significantly different than the CRD in part A of the figure…so this needs to be explained. Because part A of the figure is supposed to be the reference point (size), and no new bar markers are provided for parts B and C one is left with the need for some other way to determine an accurate length of the collagen-like domain and the neck portion and the Ntermini junctions of each of the molecules, and this appeared to me to be going back and measuring the grain size of the shadowing, and then remeasuring the CRD and collagen-like domain arm lengths.
n=80 CRD measured using a circle whose diameter covered the whole CRD as much as possible. In the gene-ed ited molecules of rSP-D, in particular the size of the CRD of the N-CRD molecules and the MINI-rSP-D was smaller. So what changes in the CRD….? or is this an editorial mistake. Red circle..diameter of mean size CRD in a rSP-D dodecamer — Gray circle, size of the CRD in the N-CRD (no collagen-like domains).
Also the means for the CRD are significantly different in these three groups, from one group to another. For example, N-CRD size against dodecamer CRD size. The CRD for the dodecamers is larger, this may be sample size error, which is just n=8 for the full size rSP-D CRD. The MINI-rSP-D is highly significantly different from the size of the rSP-D CRD. The t-value is -5.6584. The p-value is < .00001. N=32 for the MINI-rSP-D, and the same 8 for the dodecamers that were analyzed against the diameters of the CRD on the N-CRD molecules (pink, n=80).
Because the size of the background grains is not significantly different in those three sets of images in White’s, Fig 3 (a,b,c) it seems unlikely it is a shadowing difference that causes the difference in CRD size among the three group: – it might be a difference in the protein preparations in other respects. Images from other experiments would be required to verify. The CRD of the N-CRD really do “look” different from the MINI-rSP-D, the latter looking to have the three individual CRD in a more compact configuration.
 Shadowed grain size in a quick assessment, n=10 for each set of images, shows grains not seem to be significantly different in size moving from fig 3 a, to b, to c, at least with this random, but small, sample of 10 approximate grain diameters.
Little change in LUT plots for SP-D dodecamer arms
 Little change in LUT plots for SP-D dodecamer arms regardless of how I manipulate the image. THis of course gives me some security since it is very unlikely that a change in grayscale, or stretching or shrinking artificially centered N termini peaks and adjusting the arm arcs of the molecules by cutting and aligning and reestablishing arm length according to the nodal (segmented) arm length.
It also is noteworthy that the alignment of 20% transparent images (24 of them – SP-D hexamers, each CRD to CRD section taken as a bilaterally symmetrical molecule (by consensus) does not change the LUT plots either.
It really adds support to the fact that I have not done anything to alter the original image that would jeopardize the basic information.
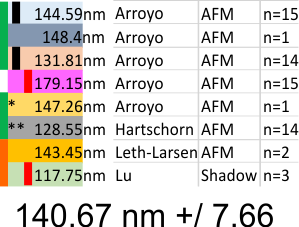
What is disconcerting is that each set of images (taken from previous publications (Arroyo, Hartschorn, Leth-Larsen, Lu and i will use others for a complete group) show that each of these authors shows micron markers which produce dodecamers that are significantly different in size than the other authors.
Reasonably, shadowed dodecamers are smaller than AFM dodecamers, I can accept that, the techniques are completely different, What I have difficulty accepting is that using images from the same publication (different figures and different micron markers) produce groups of images with significantly different SP-D arm lengths. Each vertical bar on left is significantly different from vertical bar of same color (e.g. pairs).
Girth Sorensen (SP-D Structure, Decomposition, and Proteolytic Degradation –“The amino acid sequence (375 aa) of the mature SP-D monomer consists of four structural domains: (1) an N-terminal domain involved in intermolecular disulfide bond formation; (2) a collagen domain, important for spacing of the CTLDs; (3) an α-helical neck region involved in protein trimerization and spacing of the CTLDs; and (4) a globular C-terminal CTLD (Figure 1A), responsible for Ca2+-dependent binding of microbial ligands. The SP-D protein structure is stabilized by assembly into trimers and multimers via two conserved cysteine residues in the N-terminal domain.”
*= deglycosylated SP-D
** recombinant mutant SP-D with no apparent difference in size (nm arm length) or peak number (LUT table plots)
Some reports of SP-D are dont agree with others.. e.g. The individual “arm” length of an SP-D monomer is approximately 46 nm (therefore under 100nm). But actual arm length may not impact the search for peaks between the N termini peak and the CRD peaks, since I think the best approach is to make them all a uniform length (as done in the images (24 semitransparent)
![]()
and plots below using different SP-D transparent images in different stack order to show that the plots are virtually identical no matter how they are organized.
![]()
Countless replications of LUT tables
I guess after many hours of looking at SP-D dodecamers i have really come to the conclusion that there are four peaks on the LUT (look up table grayscale plots – using ImageJ2 (FIJI)) on each side of the N termini peak.
The AFM cover images of Arryoy et al are significantly larger than other AFM dodecamers.(likely due to some miscalculation by the cover editor in the overall size of the cover image) The t-value is -20.52378. The p-value is < .00001. The result is significant at p < .05. The shadowed images (Lu et al, and Hartschorn, et al,) are significantly smaller than AFM dodecamers (excluding the cover images of Arroyo et al). The t-value is 3.50439. The p-value is .000279. The result is significant at p < .05. Just with very few shadowed images analyzed, AFM would appear to create larger dimensions. Leaving out the cover images of Arroyo et al, and just using AFM, and giving all authors equal representation, the dodecamer is 140.67 nm +/ 7.66
Falsehood flies —
“Falsehood flies and the truth comes limping along after; so that when men come to be undeceived it is too late: the jest is over and the tale has had its effect.”
Jonathan Swift
Results stay pretty much the same as previous measurements
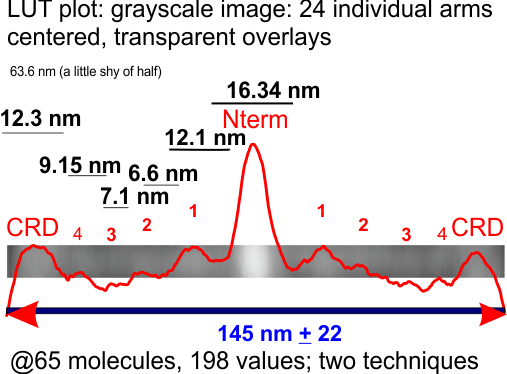
It seems there are no big break through numbers looking at the SP-D dodecamer LUT plots from different techniques, this one was all about the actual micrographs and a blended transparency built from images of 24 individual (unbiased selection) of imges (24 arms, 12 dodecamers — measured from CRD to CRD on the opposite side). THe gray scale image and the LUT plot from that image is the result of 24 semitransparent images centered according to the N terminus bright peak and the lateral sides determined by the end of the CRD LUT peaks. Nothing was done to change the position of the smaller but clearly evident, peaks between the N and CRD. The flattened transparencies were plotted using ImageJ2 (FIJI) and the plot is overlying the image and clear peaks and brighter areas correspond. It seems that four peaks (if you count the extended thickening and brightening of the region just before the CRD, which might be the “neck” there are 4 peaks along the length of the collagen like domain and the neck domain. The reasons for these peaks in brightness are not known, except for the taller and brighter peaks both symmetrical and lateral to the N termini peak.
Image=top row below. Plots and measures of the distances between the valleys of the peaks on one trimer section of the transparent overlays is shown on the left. This set unfortunately does not quite add up to the width of the whole dodecamer (145 nm) determined by curved – lines with nodes, and also with a diameter touching four of the CRD (see previous posts). Something to work on still.
![]()
A dozen SP-D dodecamers examined for LUT peaks
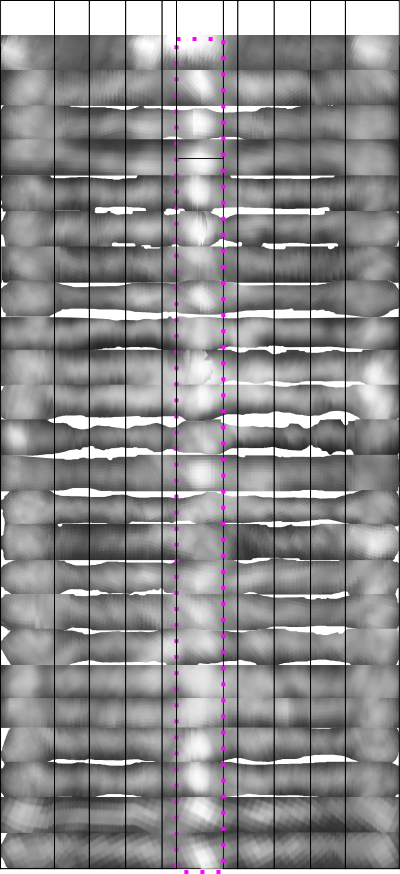
![]() Here are 24 arms from 12 SP-D dodecamers which I have cut out, straightened and placed in a vertical row, using a single width as the diminishing grayscale point on the two ends (the CRD). The vertical set on the left has width adjusted to a given size but it is clear (dotted pink rectangle) that the centers vary (Ntermini-junctins). In the 24 arms on the right column the images have been cut in the middle, and the centers “centered” which will make an overlay of the Ntermini peaks easier to measure in width. The point of this exercise (which does not use all the images I have gathered) is to test whether a composit image which has been adjusted to x nm width and central peak centered will show a definitive number of peaks between the N terminus peak and the peripheral CRD peaks.
Here are 24 arms from 12 SP-D dodecamers which I have cut out, straightened and placed in a vertical row, using a single width as the diminishing grayscale point on the two ends (the CRD). The vertical set on the left has width adjusted to a given size but it is clear (dotted pink rectangle) that the centers vary (Ntermini-junctins). In the 24 arms on the right column the images have been cut in the middle, and the centers “centered” which will make an overlay of the Ntermini peaks easier to measure in width. The point of this exercise (which does not use all the images I have gathered) is to test whether a composit image which has been adjusted to x nm width and central peak centered will show a definitive number of peaks between the N terminus peak and the peripheral CRD peaks.
I think I will try to make a case for a central peak (which is obvious) and four (which includes the CRD) peaks on each side…THe CRD peak is obviously three lumps, and the three peaks between the N and CRD are subtle, and decline in LUT values and are not all the same width.
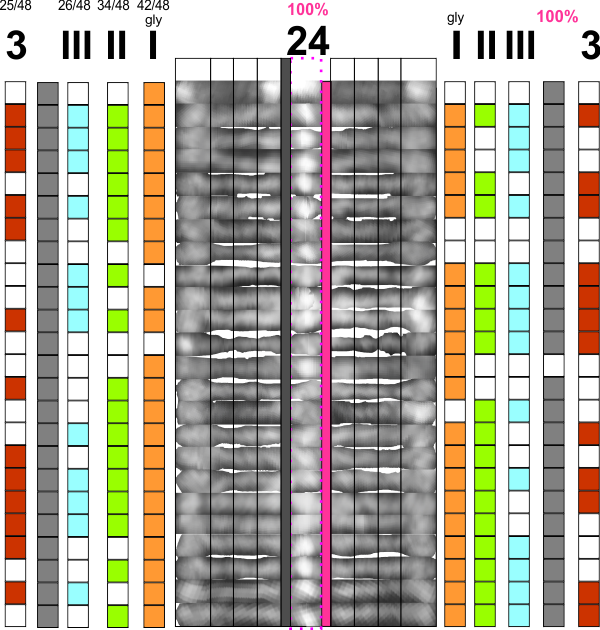 Pink=100% have N termini peaks; gray, 100% have the CRD peaks, but only half the arms have all three peaks between the former two (red). The peak considered the glycosylation site (orange), two minor peaks lateral to that (II and III) are green and blue respectively. Incidence of “eyeball” peaks declines moving outward on the arms.
A little bit of care for employees might benefit us all
Hello University of Cincinnati, and Graybach and subcontractors.
So… on the way out of the building… the Environmental Health Building, no less…I smelled some volatile organic solvents, and opening the door to the hallway there is some young kid scrubbing some tar off the floor on the ground floor level, with some mixture of VOC that nearly gagged me… he had no respirator or mask or ventilation fan going.
… i did go to the directors office and mention that if this was a UC employee we should be ashamed of ourselves, becuase this kid is melting his brain with what i suspect is a mixture of toluene and xylene and xylol and maybe hexane or some terpenes or other stuff … when queried, he is not a UC employee, but works for a subcontracted cleaning place subcontracted again from Graybach which is subcontracted from UC, which obviosly doesnt give a crap…
the fumes could be smelled up the stairwell and while they probably didn’t do anything to me, but make me aware of the unpleasant odor, and a little nauseated…. this kid likely does this for hours and days on end…. that can’t be good, and he may not know he has been put in a position that might not be good for his health.
i really can’t figure out why things like this bother me…. i know so well there is injustice, and inequality… but it still gripes me… especially when it happens in an institution that just built a 65 million dollar Public Health building about 200 years from this hall. haha… what inconsistencies.
I might add that the lawn service that UC subcontracts out to doesn’t sprays unknown stuff on the lawns in from of Environmental Health and the Public Health building… ha ha… more of the same.