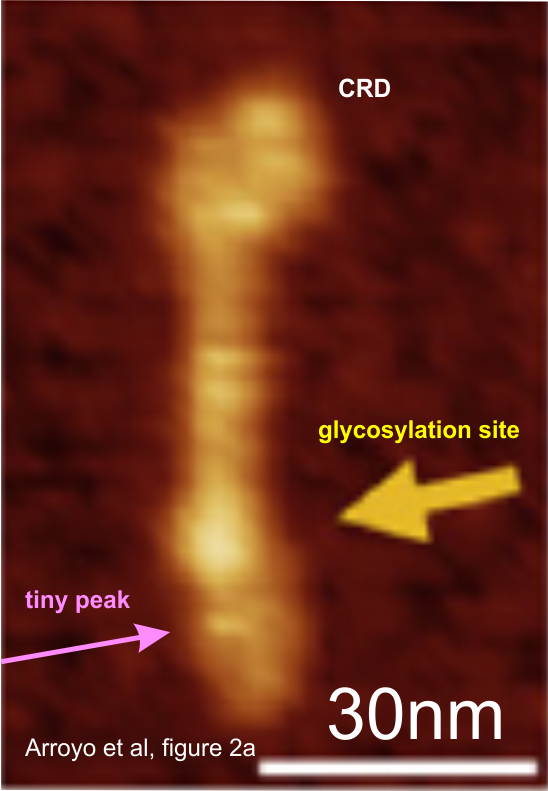
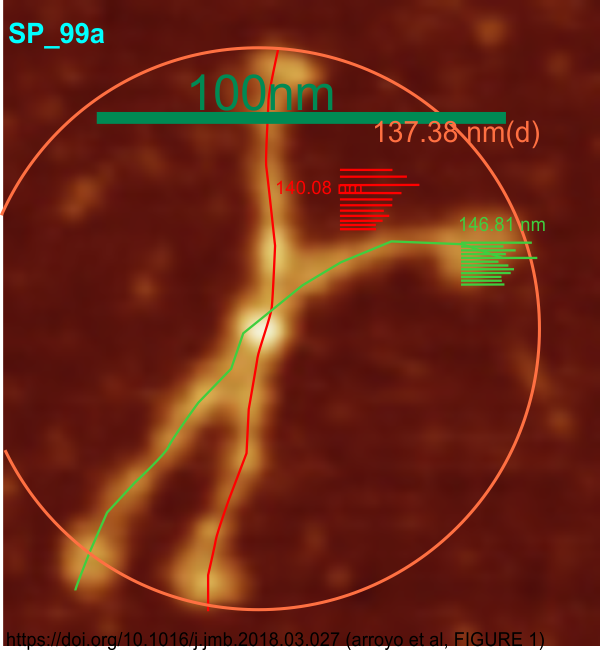
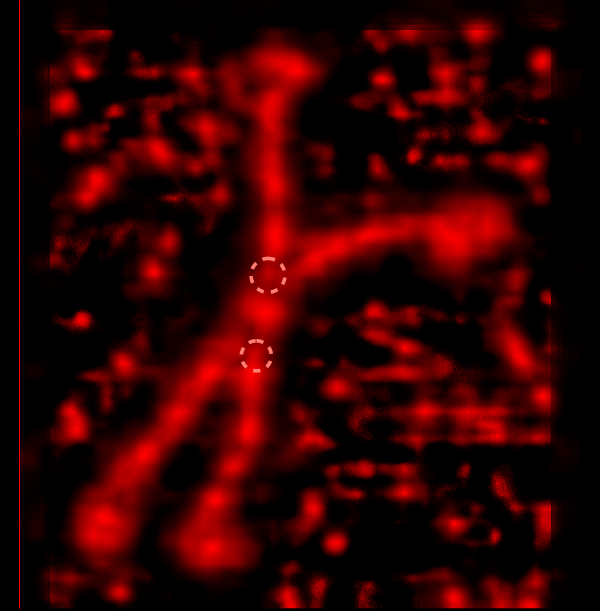
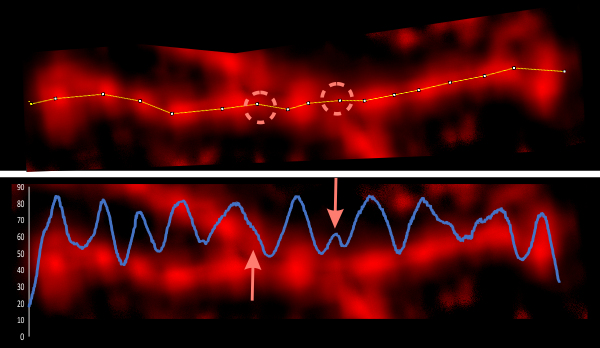
It seems to me that this small peak in the LUT plots of many many SP-D dodecamers might be real. Images below are all derived from original AFM ( screen print from Arroyo et al) which has been measured for size as a diameter using their bar marker) and as spline curves, one for each hexamer – CRD to CRD, and has been also photoshopped to increase contrast. That image was imported into gwyddion where the it was processed with “presentation>local contrast” to produce a highly contrast enhanced image. This image was plotted (again with a spline curve) in ImageJ and the peaks are marked with dotted lines in arrows. The precise plot line is shown as a screen print and the actual plot exported to excel, imported as a metafile into corelDRAW, sized to the original spline curve in ImageJ is a blue line overlying a cropped, background removed, image.
Clearly these tiny peaks are not really visible in the original image and image data processing was required to make them visible.
I have posted other images of this small peak here and here. It shows up in images and along the plots a sufficient number of times to suggest that it is not distortion, drag, bounce, artifact, but it is not always present, likely due to the forces during preparation. rotation. I dont know how the probability for opportune orientation and the expected number of times it is visible might be calculated.
I went back to the original Arroyo et al publication to see if there was mention of this tiny peak, and i did not find any. They alleged glycosylation site is so prominent that it is almost always visible and the width is in the 10-20 nm range, this tiny peak is not so easy to spot. However their image of a trimer clearly show, in the correct position, a small peak but it also shows along the trimer closer to the CRD several blips in parallel, like artifact.