Monthly Archives: July 2020

SP-D multimer, data processed, range limit

Range limit set in Gwyddion shows a multimer (shadowed — specs as previous recent posts) but measurements are a little larger than normally appears, for diameter, for segmented arm length thus, total size. Image below shows upper basic operations>range limit> upper 175 lower 100 and the CRD stand out much better in this image. I did measure the arm length to the center brightest are, presumably the N termini junction but in fact if the N termini are joined side by side, in a circle, then the size becomes more in line with other multimers from this same SP-D sample and the same shadowing procedure.

Another way to measure the arms is thinking about the N termini being attached side by side in a ring. This makes the segmented line measurements of the hexamers shorter, more in keeping with published data. It is not clear which is most accurate.

The image above is masked to remove black and dark in CorelDRAW then overlaid on the original black and white shadowed image.


Photoshop mask (aka color gradient) of a multimer of surfactant protein D.

Same SP-D multimer as previous post (and same image) rhSP-D kindly supplied by Grith Sorensen and shadowing by Jack Griffith.  It is still not possible with certainty to identify how many arms of this multimer there are, however, there clearly are 6 or more, maybe 8, and the CRD are highlighted with this method (Photoshop and eraser tool on background, mask is a color gradient on highlighted multimer, dropshadow in CorelDRAW, original image exported from photoshop as RGB, to facilitate opening in Gwyddion as original multimer (image on left). This image processing picks up a second concentric circle surrounding the N termini in the center. Peak brightness highes in orange and then red.

Gwyddion’s image distortion>radial smoothing on an SP-D multimer

Gwyddion’s image distortion>radial smoothing on an SP-D multimer: A series of distortion options were applied to an already nice rotary shadowed image of a recombinant SP-D molecule (kindly supplied by Grith Sorensen and shadowed by Jack Griffith) shows the extreme processing available through this program, but also it shows that slight processing actually can enhance elements of the image. Original is bottom right. Degrees of radial smoothing and pixel counts are provided in each of the images.  One arm, image below, was particularly close to what is seen with AFM. It has a great CRD (even with three-shadowed areas) a neck like thinning area, and bumps along the collagen-like-domain, and a bright spot where some say there is a glycosylation site, which may or may not show up here, and the N termini group (part of which is cropped out). You can find this trimer in the top 11 processed images as well as the original (bottom right).


Gwyddions website states thus: Data Process → Distortion → Radial Smoothing “Radial smoothing processes the image with a Gaussian smoothing filter, but in polar coordinates. This function is useful for images which should be relatively smooth and exhibit radial symmetry.

The image can be smoothed either along radial profiles – with Gaussian filter width controlled by Radius – or angularly along arcs of constant radius from the centre – with width controlled by Angle. The transformation to polar coordinates and back does not preserve the image perfectly. Subtle (and occasionally less subtle) artefacts can occur, in particular close to the centre, even with no actual smoothing.”

A couple of things to note are: The deep darkening of the image (presumably if this were AFM it would be a valley in the LUT plots) next to the larger (but not dead center) bright ring.  This could correspond to the same peak just lateral (lateral in the sense of concentric and outside the center of the multimer) the alleged glycosylation site in AFM images.

Following the rays as they are processed from the original to 75px radius and 5degrees, it seems to show about 7 arms (maybe 8 — which would me a nicer number, as in — comprising 4 dodecamers), each relatively equally spaced around the center N termini bright spot. Also, the central bright spot, which is consistent in AFM images, can appear one of two ways, 1) like a single non-splitable peak, or 2) more like a ring with a hollow center. It has been my suggestion since the beginning, and a major part of the reason for my examining the SP-D multimers, is that sometimes (not the majority of times) the N termini junctions might be side to side, not end to end.

NO clue

I do not have a clue what 2D autocorrelation does in Gwyddion (yet) but it is so odd that it produced this image of an SP-D multimer.  I see the N termini junction, and a concentric ring which is only very faintly visible in the original, and around that ring lateral lines with four blips.  haha.  but no CRD.  Any clues.

Two SP-D fuzzy balls: rat SP-D and rhSP-D

Two shadowed images (top left published rat SP-D, 1994, Ed Crouch et al) SP-D multimer. Methods mention platinum and 10o angle. There is a lot of detail that I particularly like, mainly the dark area around the N termini group and the bright peaks (making a ring at about 35nm from center) and even in many of those arms there are smaller concentric rings that I would hope someday will turn out to be equivalent to the brightness peaks that occur routinely in AFM images of SP-D.  Image on the bottom left is my measurement of the top left image. There is no bar marker on the set of images from the publication by Ed Crouch et al but they do give a mean diameter (CRD to CRD) of 114nm.  I measured two of the arms to the center point with a segmented line and came up with an almost identical dimension (see lines and nm values on bottom left images).

The top right image is a recent photo sent to me by Jack Griffith, made from recombinant human SP-D prepared by Grith Sorensen.  The method of highlighting the multimers (detailed in Ed Crouch’s manuscript – where they used a gray lettreset screen over the entire image then brushed away the gray screen in areas that were just the SP-D arms to highlight the molecule) I basically copied on Jack Griffith’s image however i used Photoshop, and a 45% screen and the eraser tool to highlight the arms of rhSP-D in the image.  (Both images are inverted from their originals). There are interesting differences and similarities. Size is one difference, and perhaps the angle of shadowing and the amount of shadowing in the left images gave me the impression that the CRD were a lot bigger (nm in diameter) and a greater part of the arm of each trimer than they apparently are. CONSIDER differences in species/SP-D size…. and protein preparation and shadowing techniques. (left images ratSP-D, right images recombinant human SP-D).


New images of SP-D dodecamers – shadowed

A request was made of Grith Sorensen and Jack Griffith who graciously produced the SP-D and the image (respectively) which is quite different than the SP-D dodecamers that were shadowed by Ed Crouch years ago.

I am working to find out what differs in the technique for shadowing. This is a clean image but does not have the oversized CRD shadowed on the ends of each of the trimers and the N termini junction in the center is no where near as lumpy as images of Crouch et al.

Size measurements on this dodecamer do fit nicely with previous measurements for shadowed SP-D.  upper left=original image, upper right, cut out of the dodecamer as I WAS IT; lower left, segmented line measurements of two hexamers separately, red line=85.61nm (so a little short); green line=119388nm; diameter (touching three of the four CRD=115.20nm. Lower right is just a coloring of the dodecamer – as i see it.

and a new set of measures is seen below…..   a different diameter – touching three CRD position which does change the mean diameter of this SP-D.

Bovine conglutinin: Did image processing improve information

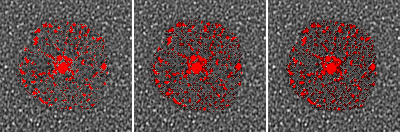
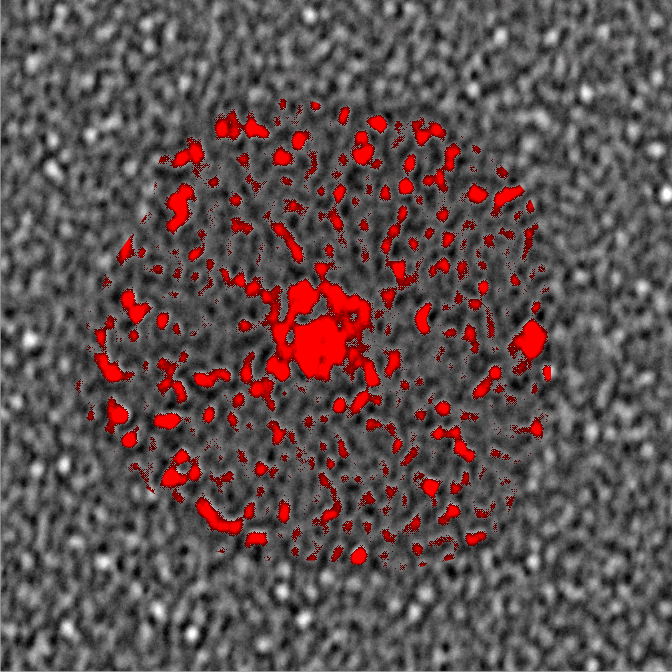
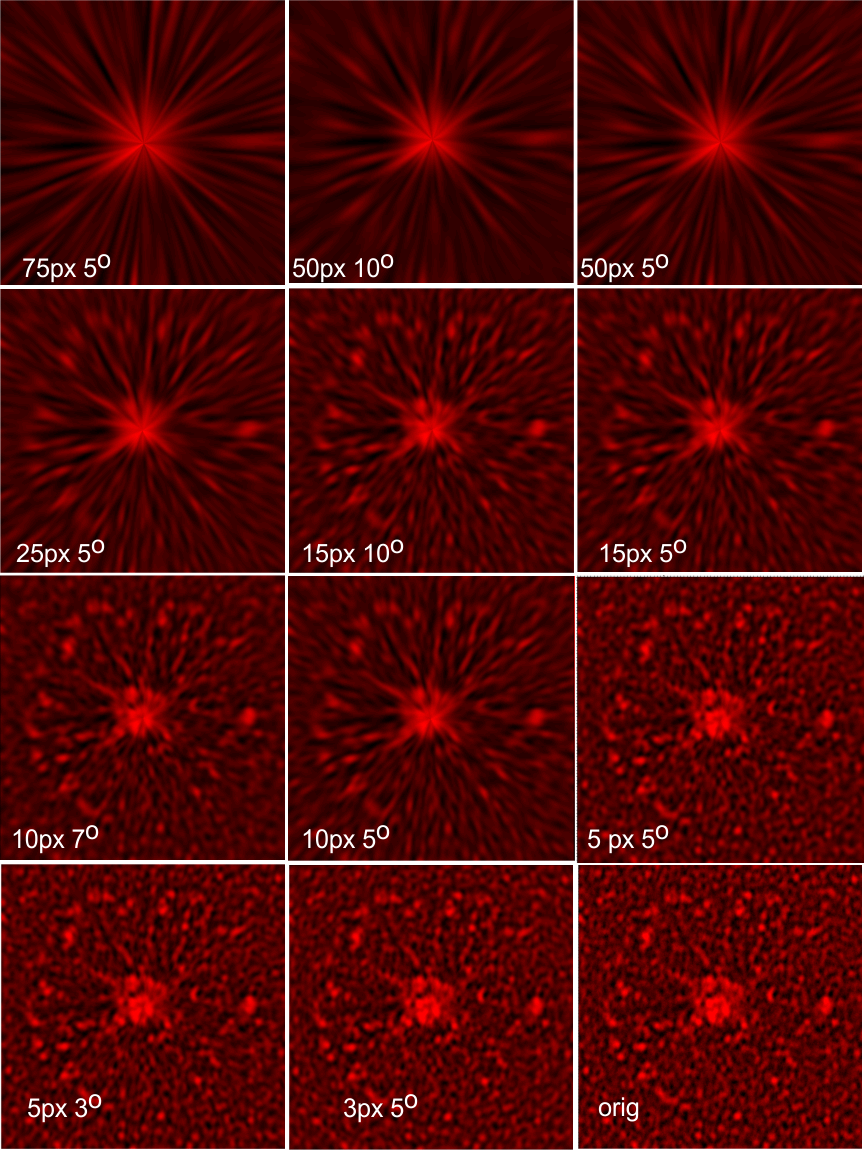
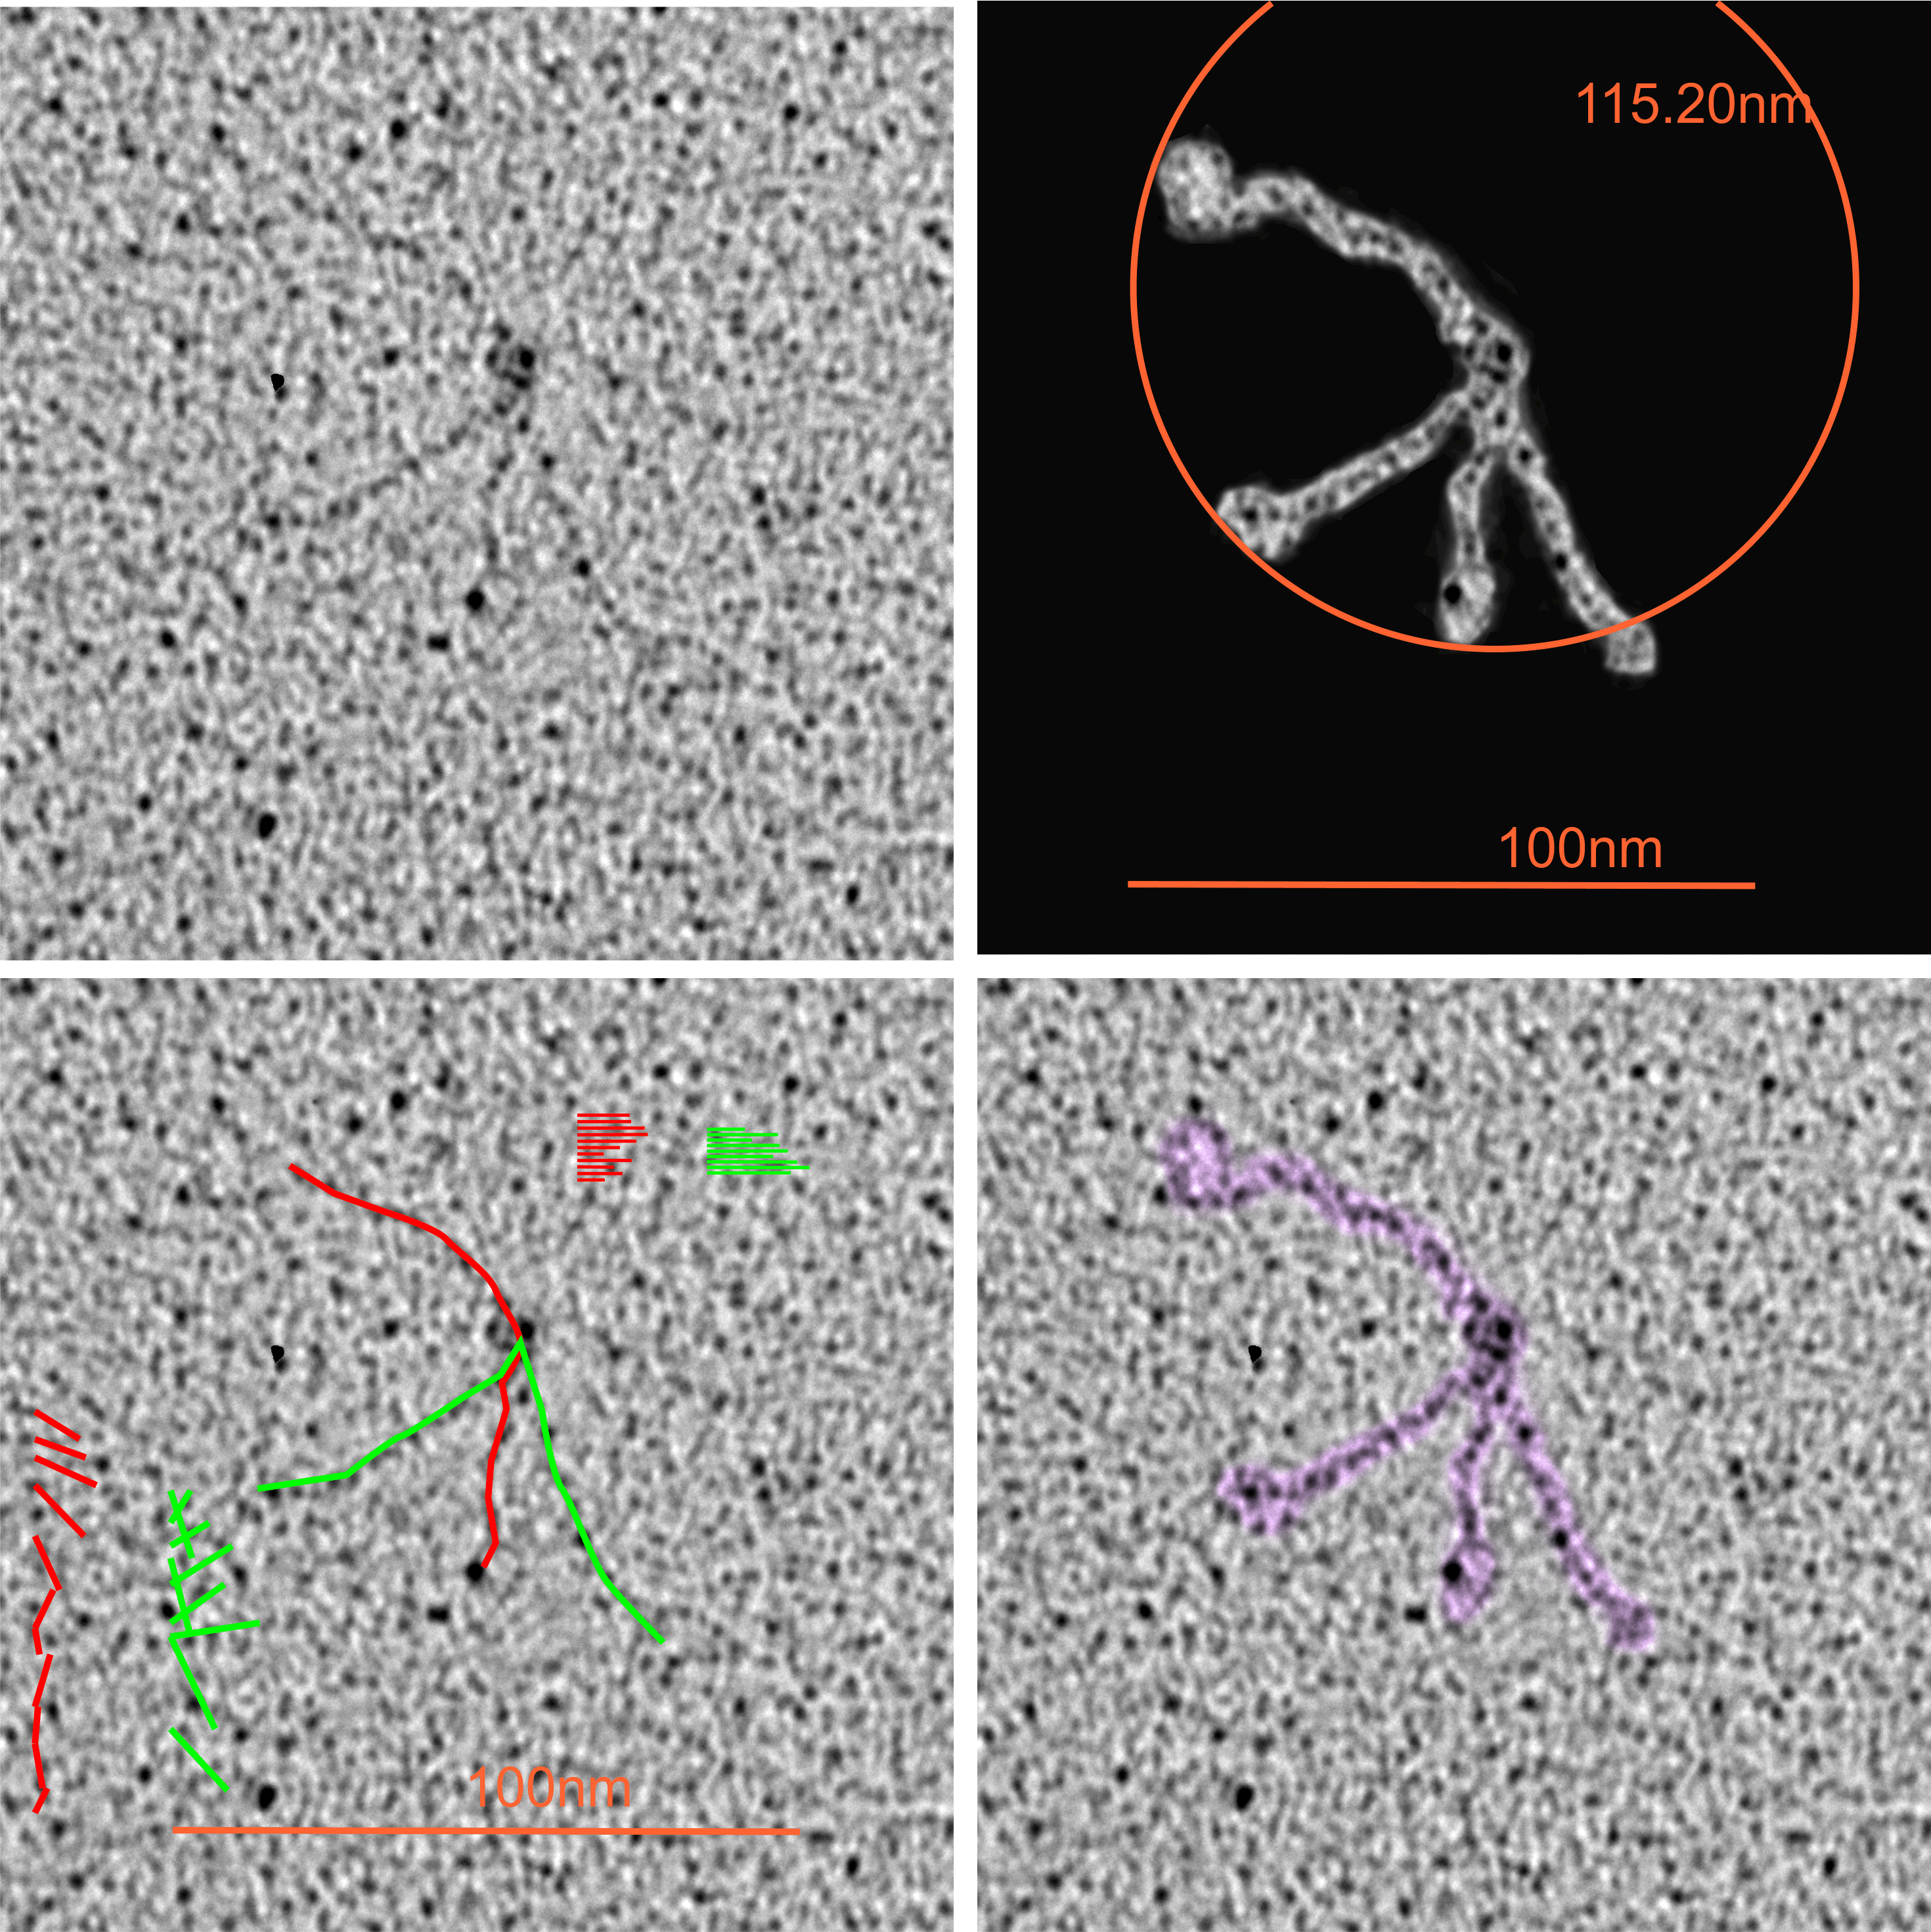
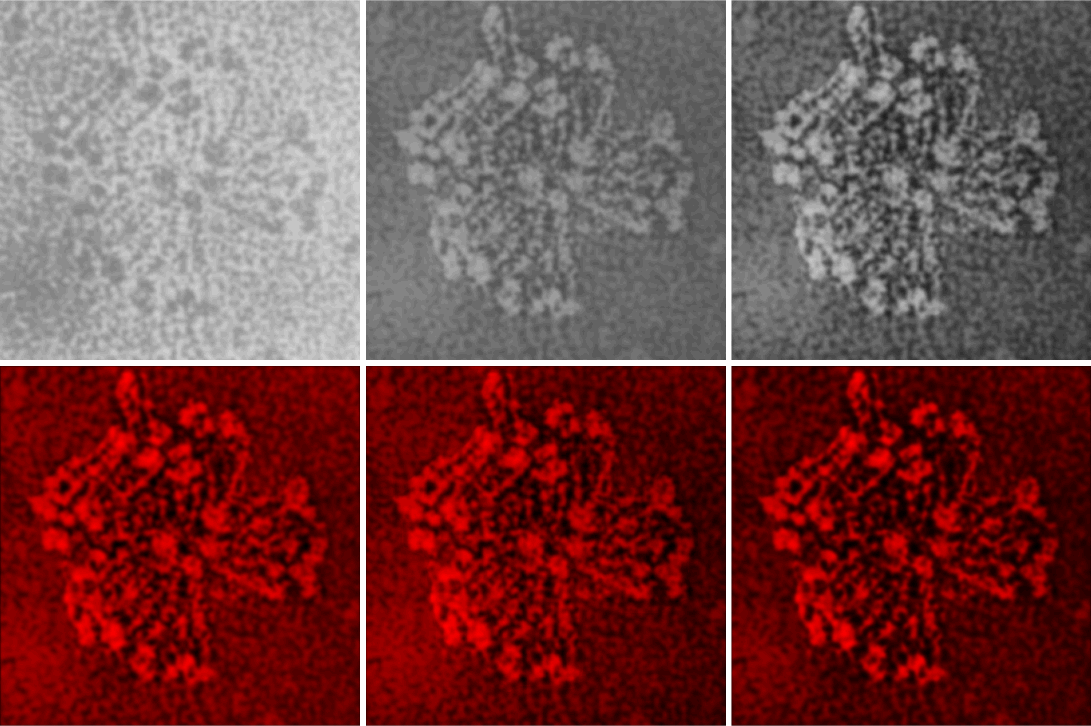
Bovine conglutinin: Did image processing improve information in this image of a multimer (Andersen et al)? In one sense i think it did increase the ease with which one can find the N termini (which in this case seem to be side by side) and also it increases the ability to see what seems like an acute folding of all four arms of the bovine conglutinin in to an arrow shape, with the point being the N termini junction. This was both an exercise in using Gwyddion to perform data processing (the 2D continuous wavelet transform (7 px gaussian).

Top left image (original image Figure 8b, Andersen et al, 1992) tantalum shadowing. Top middle, photoshop layered background contrast reduced, top right, image inverted and flattened and contrast enhanced. Bottom left, image imported into Gwyddion, bottom middle 2D continuous wavelet transform, bottom right, saved and highlights, shadows and midtones adjusted in CorelDRAWx5.

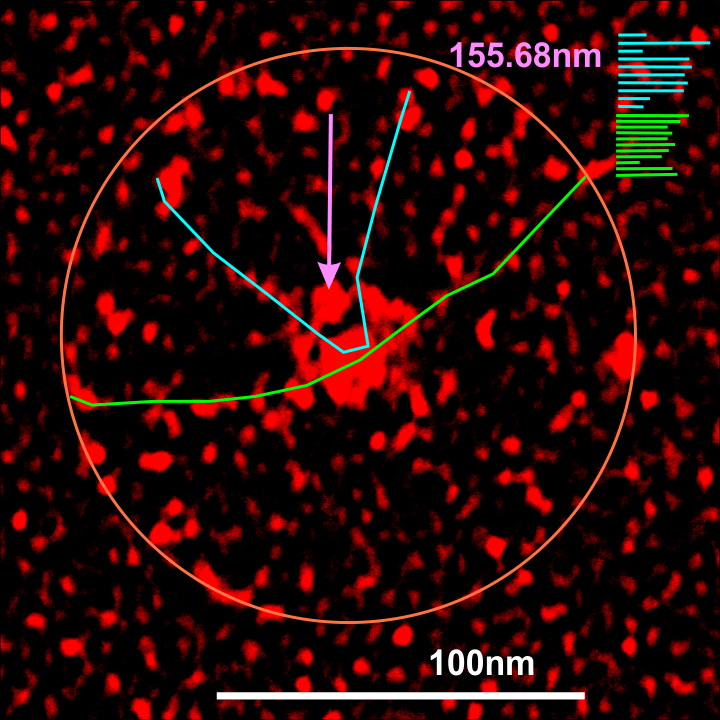
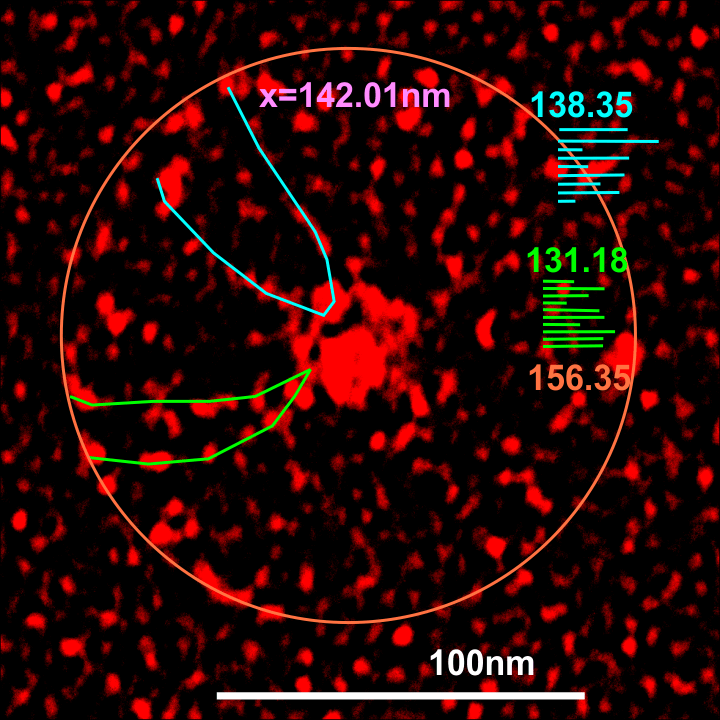
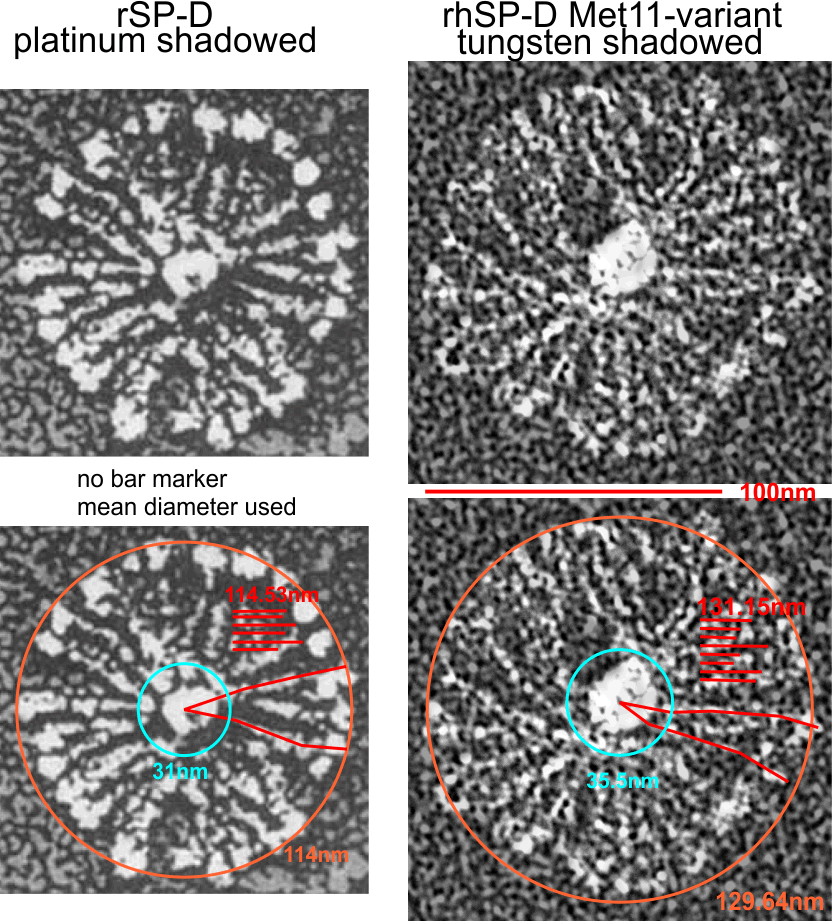
It is amusing to see peaks along the arms of the bovine conglutinin collagen-like-domain… three or four little luminance peaks, reminds me of SP-D. Upon measuring them in imageJ, it would be difficult to distinguish these peaks from background. I will figure out a way.

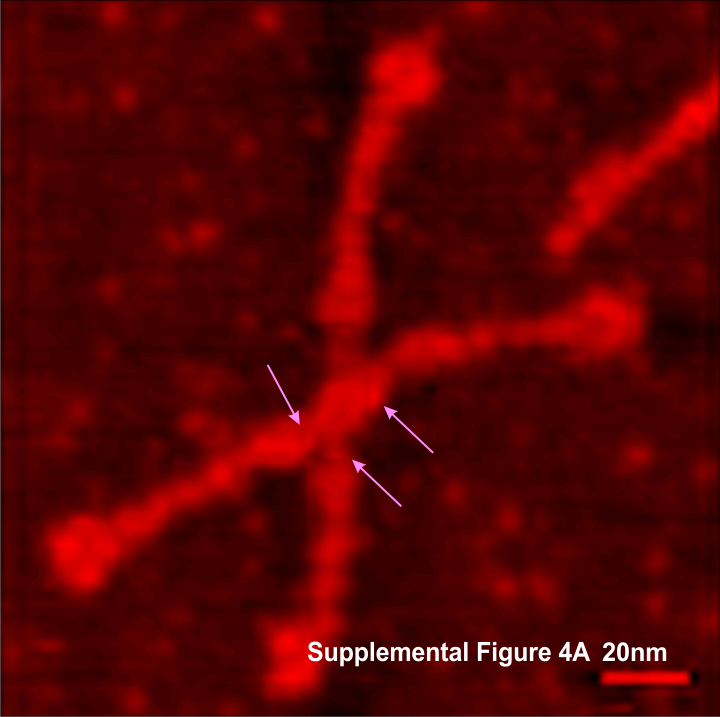
The N termini junction has the distinct look of dodecamers bent at an acute angle and nestled together side by side (nb the bottom group of four N termini junctions and approximately 16 independent arms radiating.

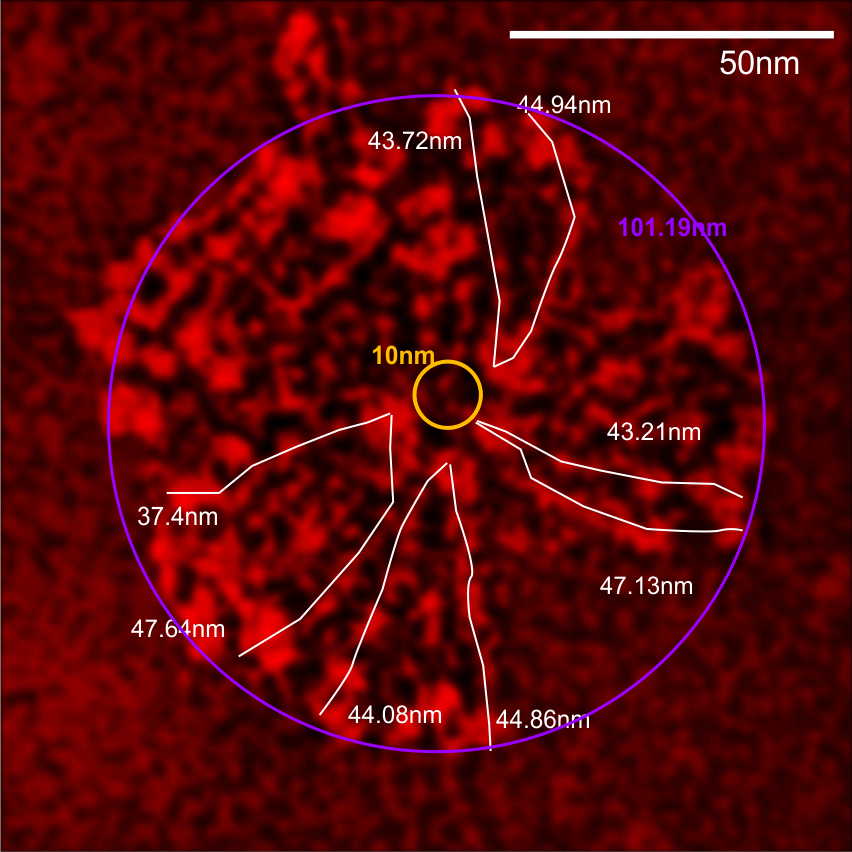
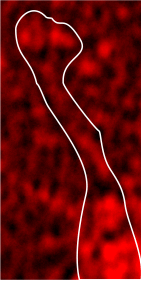
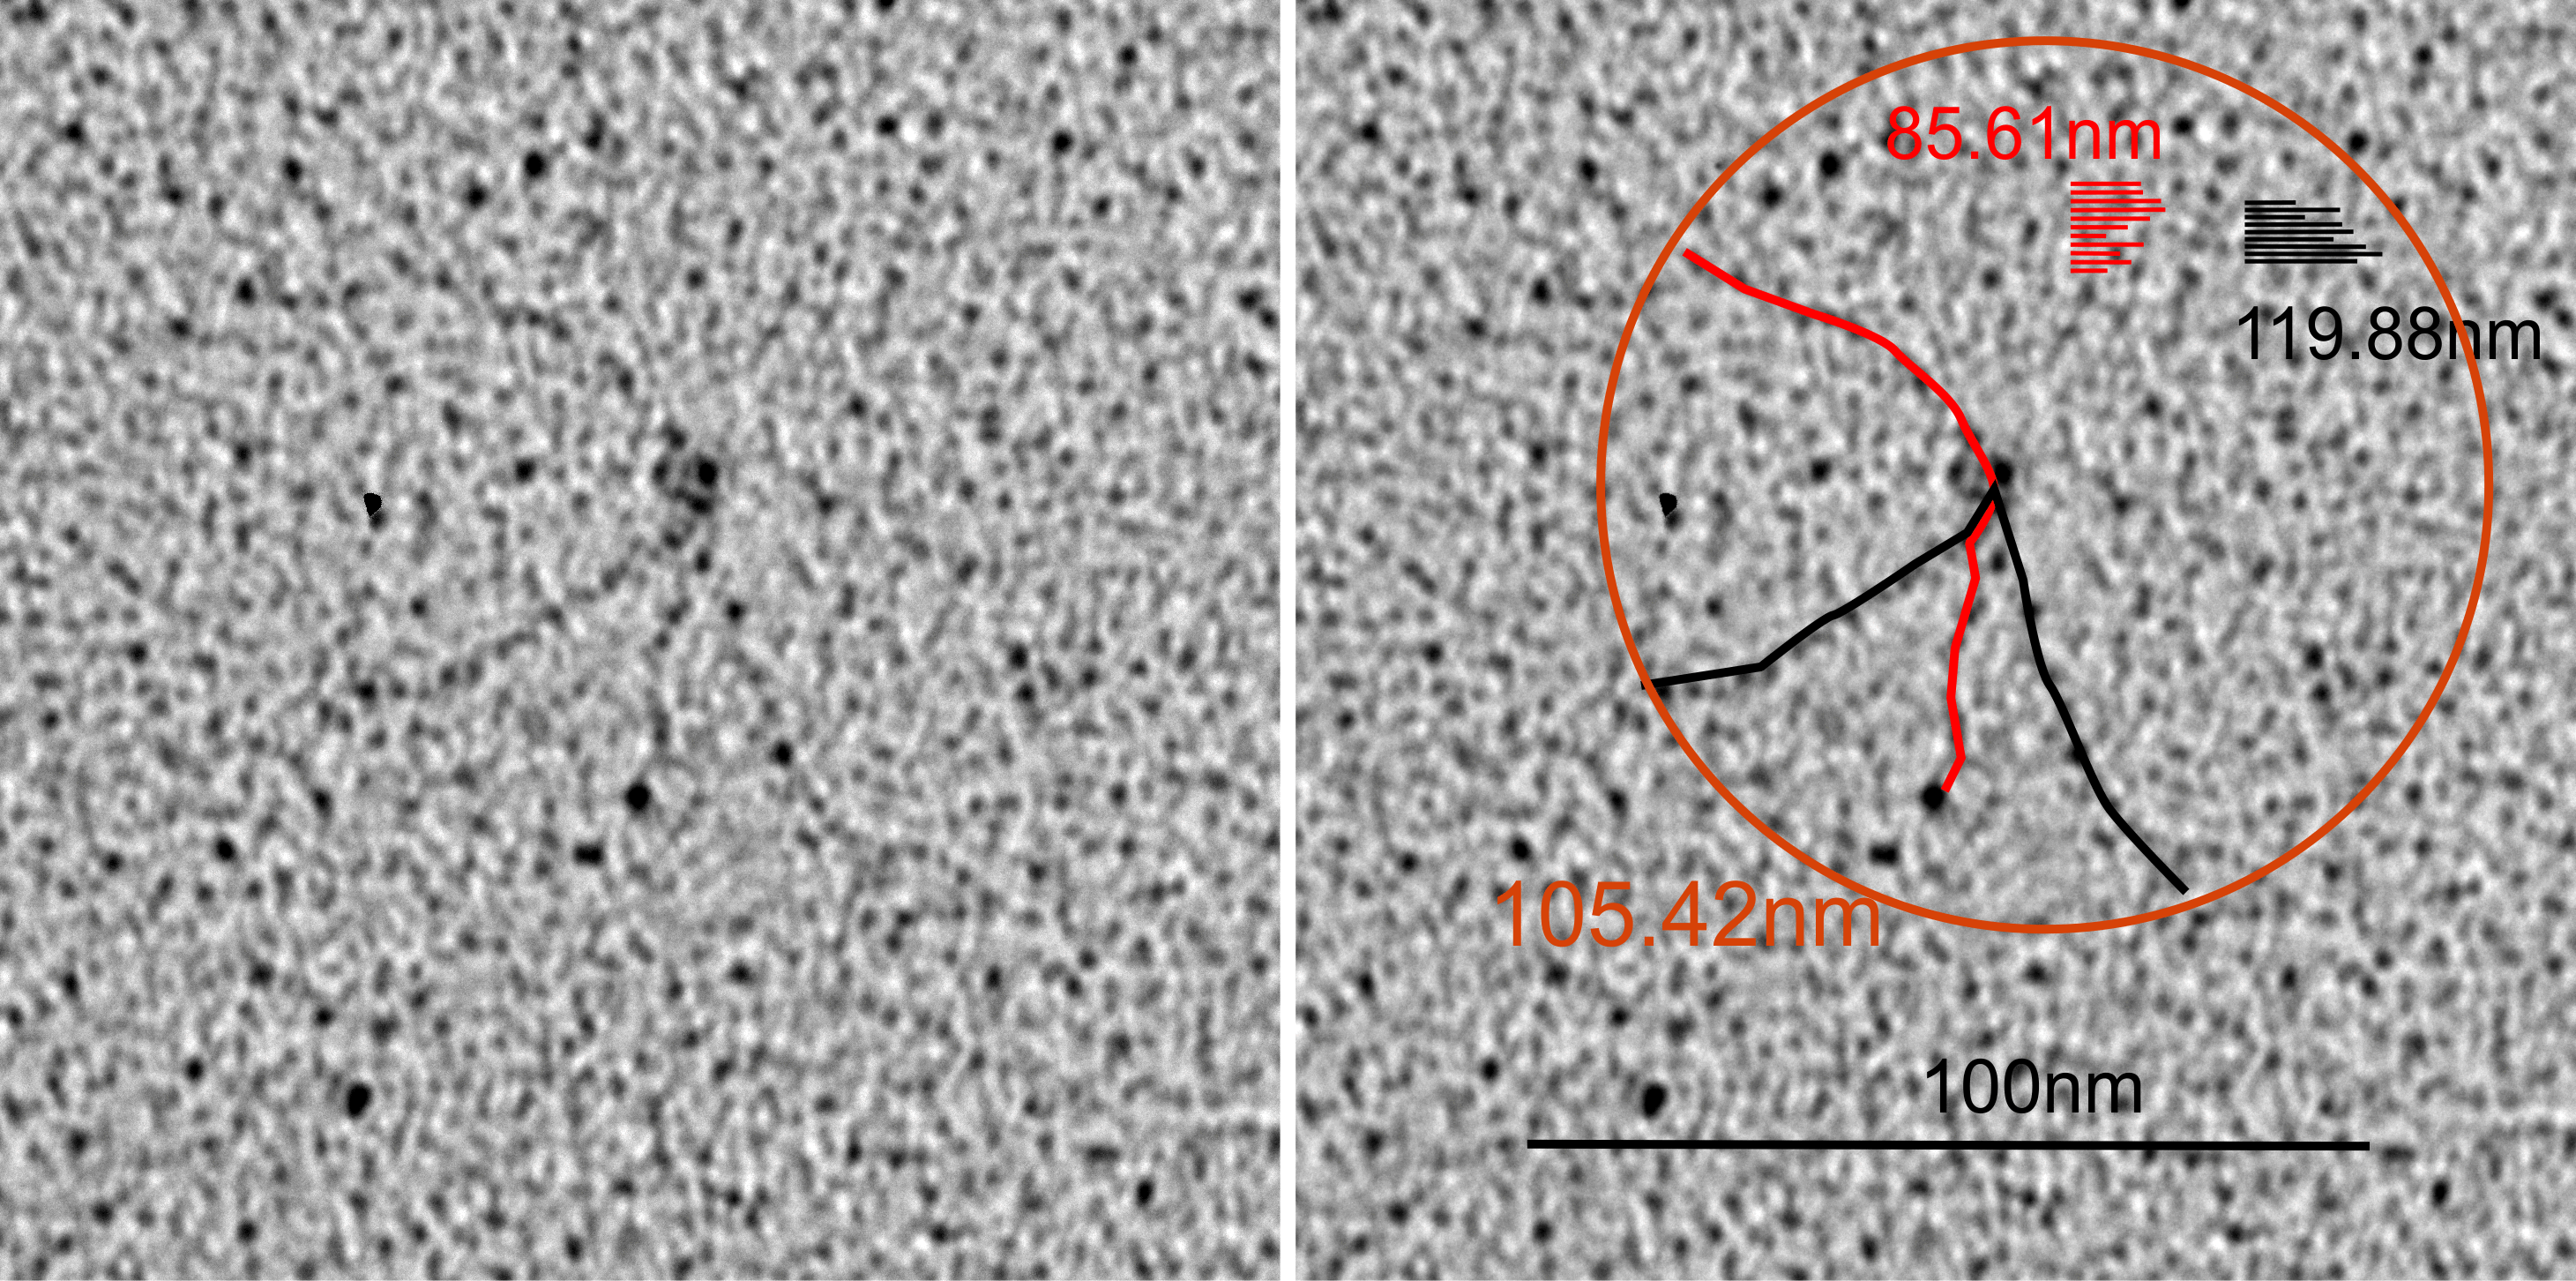
Andersen et al report that the arm length (in their figure 10 and legend show an arm length (without the CRD as 40nm, and the CRD as contributing 4.5 to the length and add to that another 3.25 nm (half the N termini group) comes out to 47.75nm, which is like their 48nm reported as half he 96nm CRD to CRD total that they report.

Individual arms were measured with a segmented line but in this sample the length of the arms did not differ from what they measured as the “whole multimer” (see below). That said, my diameter measures 101.19 touching many of the outer borders of the CRD, so there is a 4nm gain thee somewhere. A measure of a circle that is not best way to measure this shows a 10nm gap (which might be less or more depending upon the multimer). I wish I could say that there is a ring concentric to the N termini lumps that looks like an elevation for a glycosylation site – but i dont see anything that resembles it here.

Four new little luminance peaks in SP-D: revisited

Four new little luminance peaks in SP-D: revisited — this is an AFM image from Arroyo et al which has been examined way beyond anything that is important, perhaps. That is countered with that in using this image with as many different programs with their various transform algorithms I have found some convincing evidence that there is a very nice little luminance peaks between the N termini juncture of an SP-D dodecamer and the purported glycosylation site (which is the big peak adjacent to the N termini.

Three arrows below point to three tiny luminance peaks that showed up after taking the image from their figure 4A (supplement to their manuscript) and doing a 2D continuous wavelet transform (Gwyddion) and a Step Line correction (Data process>Data correction>step line correction). Presumably this would be a symmetrically arranged event so there should be four, but chance and circumstance always play a role.

An additional thing that is apparent is that in this particular dodecamer there is a depression in the peak (which in most images (including this one in its unprocessed state) does not have a depression in the middle of the N termini junction.