Over 14 peaks, and a mode of 15 peaks was found as the mean of peak counts of a single surfactant protein D molecule (an AFM image) using five programs, and within each, a variety of peak finding settings. Each of these programs defines how they detect peaks in different ways (which makes it a little difficult (for a non programmer like me) to compare them. Nevertheless, the number of peaks seems to be very close to what is found by application of conventional image processing filters and masks.
A list of the image processing programs used before signal processing is provided on the left, the types of image processing is give above that list. (two programs were not used, inkscape and Octave, the former because it did not have the conventional filter names and applications as other programs, and Octave because this program was very cumbersome compared to dedicated image processing programs. Again, the mean number of peaks is very close to that found with image processing alone. 
Counts of peaks with signal processing algorithms do NOT include counts from the image directly, or the original plots created in ImageJ, unlike the values found in the mean number of peaks using image processing. The list of full names of the image and signal processing programs has been in previous posts.
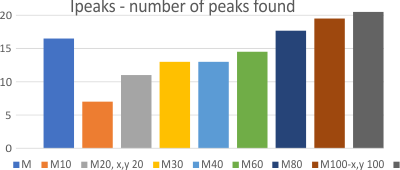
Two image processing programs (cpp19 and gwyddion) were used with Octave as a signal processing program to detect peaks. Images were subjected to either a 5 px or 10 px blur, and then using gwyddion, some were subjected to a limitrange filter (100-255). Various settings were used in Octave Ipeaks. Except for the limitrange (most right set of numbers) more peaks were detected by Octave than by peak counts by hand from images, or plots. Number of peaks found was easily shown to increase when the suggest peak number was increased.
Ipeaks input statements and results were grouped as above (and individually, below).