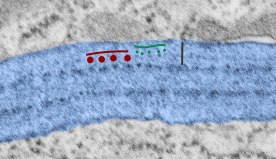
More on the periodicity of the dense outer bands of the alveolar type II cell surfactant granule. Still think this is probably surfactant protein A. I have been assessing the densities in the darker outer bands, which are rounded molecular complexes, much more clearly seen on the tangential plane (yesterday’s images), and which looks to be something over 30 nm in diameter (using an adjacent ribosome as the size reference), and only two (with space between) appear in any 100 nm stretch. The punctate nature of the lighter bands in this granule seemed to be more like 5-7 per 100 nm, so there is an obvious difference, both in size and in spacing of these two entities. How do they knit together into the granule?.
Dense bands are more continuous than dotted, particularly views perpendicular to the length of banding, but I would suspect that differences in the appearance of dense band periodicity has to do with the way the proteins denature depending upon the constituents of the fixation fluid, whether more or less calcium is present, or whether it is more hypertonic, or isoosmolar, but this is conjecture.
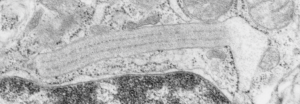
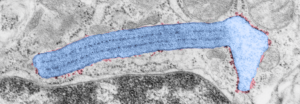
Figure below shows the intermittent densities in a perpendicular cut, unlike the post yesterday which showed the dense band densities on a tangential cut (and more pronounced). Figures below are arranged thus:
- quintessential alveolar type II cell surfactant protein granule UNRETOUCHED- Electron micrograph shows a granule with three linear periods and a ballooned end. Diameter of one ribosome is taken to be 27 nm, one period 100 nm (vertical black bar marker) therefore the whole granule here is approximately 300 nm in height (thickness). TOP
- quintessential alveolar type II cell surfacant protein granule with ribosomes which are on growing ends (and in this particular image, on the balloon end, and a couple of ribosomes on the opposite end, with membrane without ribosomes parallel to the long axis of banding. Ribosomes are PINK – and – the
- quintessential alveolar type II cell surfactant protein granule itself, is BLUE
- measurements of periodicity in dense as well as light bands BOTTOM, with green line over green dots (representing about 15 nm diameter punctate periodicity for lighter bands and red line over red dots (30+ nm diameter) showing periodicity of dense band protein molecules.


