Category Archives: Electron microgaphs of lung

Various species of mammal and maybe a non mammal now and then have been obtained and examine using routine transmission electron microscopy. These are summary images.

What is the trend in diagrams of surfactant protein D

The diagrams which frequent scientific publications on surfactant protein D (SP-D) are countless. I have gathered more than 27 diagrams of the SP-D dodecamer and some multimers (fuzzyballs) to see if there is conscensus in the literature about the angle between the arms of the SP-D trimers (of which there are 4) that comprise these oligomers. I have also gathered many more images of actual micrographs from publications (various methods for TEM) to see how closely the diagrams might approximate what is see in various preparations of isolated SP-D. I will mention one publication (which I have linked before) by Arroyo et al, that measures some of the angles of various multimers of SP-D and reports them in a continuous bar graph by anglular dimension.  I have done a similar kind of measurement (measuring the acute and obtuse angles of the dodecamers and less often diagrammed fuzzyballs in chart, and have also measured the dimensions suggested for the center N terminal associations. Sometimes there is no indication of the N terminal associations in diagrams, other times there is an indication, either a straight line, or lumps or circles, and in one (unfortunate diagram) as a square. The N terminal area is typically represented at about 10nm.summary of SP-D diagrams in scientific publicationsFrom the beginning of this assessment, it was obvious that some investigators tried to incorporate some actual structural elements of SP-D into their diagrams, others just copied what had been used before.  In almost all cases, the arms (composed the three SP-D molecules) have the carbohydrate recognition domains shown in a (pitiful) oval, mostly oriented at a 90 degree angle opposite of what is seen in actual protein modeling of the CRD.  So this is visually confusing, and added to this is the fact that the CRD domains are frequently not accurately sized compared to the whole of the SP-D molecule. The only explanation I can come up with, in light of very nice DRD data in the RCSB PDB, that this is just a matter of the author’s disregard for using correct graphics in scientific illustration. Two diagrams in particular are just way off base (easily found in the collection above).

Most of the literature gives the measurement of a dodecamer at about 100nm diameter, and this is the “green” circle in images below. I have placed a red dot over the images where CRD are positioned. In the diagrams above it is obvious, however, in the actual TEMs of prepared SP-D multimers it is not always obvious. But I did this for the sake of continuity between the diagrams and the actual SP-D images (a chart of images will come later).  Angles (both acute and obtuse) were calculated using an anglular dimension tool. Each angle in a multimer was measured as well as the center distance designated as the N terminal.

After calculating all values, I removed the values for two diagrams (above bottom row) that just didn’t pay any attention to the real TEMs and made their SP-D diagrams with four 90 degree angles. There was a definite trend in the diagrams (haha… copying the first guy to post a diagram likely) to have acute angles (something close to what was measured by Arroyo et al), and here measured at  45o (their SP-D dodecamer images were prepared in the pH ranges of near 7.4 and 5.5 and had acute angles of something less than 40-50o and a corresponding obtuse angle. The latter for some reason was more variable than the former. The actual measured mean in these diagrams above was in fact 45o which surprised me being so close to what is reported to the real TEMs.  Each diagram on its own seemed not very representative of what has been reported, but collectively, if one spends the time to view them all. The significance obtaining measurements of angles between the arms of SP-D oligomers relates to the possibility of using such measurements for the construction of nano-particles with SP-D as components. The most efficacious placement of the CRD needs to be calculated. And while it seems unnecessary task to use diagrams as a beginnig point…. I was hoping to point out the sometimes obvious flaws of careless diagramming, before making a similar chart of actual molecular images.

Off-center N terminals of SP-D fuzzyballs

surfactant protein D SP-D fuzzyball moleculesThere is nothing I am doing here but questioning the current notion of how surfactant protein D is arranged into fuzzyballs. I have none of my own images to present, just those published by others which count is close to 75, from several authors.

The publication of Arroyo et al that I have mentioned many times has very lovely AFM micrographs, and they have provided counts of 600+ SP-D images, and it is from these the few of these they published that I am making suggestions that perhaps the N terminals of surfactant protein D molecules are NOT dead center, but arranged in a sort of “ring” near the center instead.  The other suggestion is that the arms of the surfactant protein D hexamers (maybe dodecamers) are not straight rods, as almost universally depicted in diagrams of SP-D, but rather are gently curved, almost as if they are hexamers whose interaction at the center is tangent to a center sphere, but at an angle of 60-100 degrees. In measuring the angles in just this one fuzzyball, the average degree was about 67o. (lower left is measured from the dotted lines in upper left — nb, this was just one fuzzyball, and there are many ways to draw those arcs than the way I drew them the first time.)

Image on the left (with its dotted lines) is almost identical to the one posted before (here) but i changed the bending of some of the dotted lines to what I thought was a better fit.  In addition I added two more images, with different contrast, and outlined in blue the areas where the N terminal portions of the hexamers make a tangential connection with each other. I think that this (and other fuzzyballs I have  observed) pretty much show up as multiples of 2 which is what might be hexamers.  Of those which I have currently measured, there will be an angle between SP-D arms, but I will also measure them again, thinking of the molecule itself as an entity which is made up of slightly curved hexamers (or possibly dodecamers), and the angles will certainly be different.

One thing that makes the N terminal attachments NOT being dead center is the presence of slightly brighter areas near the N terminals, which could be representative of the glycosylation sites.  For small bright areas to show up at a distance which is proportionate to the ring-center, is encouraging.

Lower right figure has a single hexamer (bent) in which i have measured the angle, and also outlined the bright areas of the N terminal(s), and possibly the glycosylation site(s).

I am impressed by the fact that the CRDs are “lumpy” in this particular image, and I have traced around them, there are almost suggestive of the three CRD domains of the trimer.

One thing that is easy to question on this post is why i drew the arcs with a convex curve and why the sample of a hexamer looks like the curves are concave..haha  good question.

N Glycosylation site on SP-D

There is a little discrepancy here,  likely due to the dearth of protein modeling for the complete protein of surfactant protein D.  In any case, you can see from the picture of Arroyo et al, (top) and a diagram (middle from a commonly reproduced diagram available on the internet) which has N glycosylation site in a different relative position, and Arroyo’s diagram again lower middle which might come close but is not exactly where the bright spot is on the AMF image, and the bottom image, also from a google search which doesn’t bother to show an N glycosylation site.  Dotted line lines up where this “might” be in parallel diagrams. You can see there is lots of variation.  So to be more precise in this i should have overlapped the N terminals in the second figure down.  and checked to see if in fact the branch indicated actually was intended to be a glycosylation site. (not so LOL). I will try to edit this later.

SP-D fuzzyball structures microscopy

Surfactant protein D – fuzzyballs

Arroyo et al have published what I think is a great paper using atomic force microscopy to look at many different multimers of surfactant protein D.  There are a couple of things that I think they saw that might be what I also noticed looking at so many images of SP-D with various EM methods.

That is, there seems to be a blip or bulge in the SP-D structure close to the N terminal, and I marked that with some images in a previous post, then removed them for a summary page and the early video clip of SP-D.  I think they are real, and also this publication indicates that it is the N glycosylation site…. and used some experimental manipulations to justify that view. Another issue is that the N-terminal sites of SP-D dont really often line up into a single area, they look sometimes like they are groups of separate arcs which have an angle of about 40 degrees (as measured on the micrograph below (the small angles) two angles were about 120 degrees.  The center doesn’t look like a concentric area, rather a radially spaced loop-association.

This micrograph is from Arroyo et al, and it shows (as do many other images from their publication) what I am trying to indicate. Actually many of their fuzzyball micrographs show this the inner segmented ring rather than a single central density. I used their picture,  and photoshopped it to eliminate background notations and debris, and other nearby molecules (you can see these in their original picture so you can compare) but I did not change the image of the molecule in any way.  SO: one of the big issues is the curviness to the arms of the SP-D molecule (see my blue line in the image below), and another is the-off-center radially arranged N-terminal densities. These just make it unlikely that there is a “center” point where the N terminals come together in a single lump space.  A third issue is that it seems like the angles between the hexamers (if in fact that is how they assemble into fuzzyballs… one hexamer at a time, or perhaps one dodecamer at a time, where the the angle is not that “acute” but is pretty broad, maybe on the order of 40 degrees.  This is what the dodecamer shows most typically so there may be a reason to assume that in the fuzzyball that the 40 degree angle for the four arms (and a broader angle of 140 degrees between arms) is maintained. Blue ring (that I have added to image below) might be where other interactions in the fuzzyball structure bring the structure together in a sphere? or disc? at points of intersections of the “loops”.  Other loops and centers around the blue ring are shown with white dotted lines.  This particular fuzzyball one would prefer to see with even numbers of arms (they may be there)…. but apparently an arm or a couple of them got misplaced in the preparation process (LOL)… it is also my suspicion that there is a quantity  “four” –  that is, that the elements are divided into quadrants as reasonably convincingly shown in the micrograph below, and that works out to the 16 arms (an even number and multiple of 4) which pervades the surfactant protein D images that I have collected so far. White bar is 60nm according to Arroyo et al’s original image.  Blue circle is about 40nm relative to their white bar marker.

organization of arms of surfactant protein D fuzzy balls electron microscopy


Are there angle restrictions on distribution of SP-D trimers in fuzzyballs

Looking through as many SP-D images as I could find in the literature I began to sense that the distribution (radial) of SP-D dimers was not random. I am determining the angle of separation of each arm of a SP-D fuzzyball to see if the numbers fall into classes of small, and larger. The data for these three pictures is spot-on.  Various authors are responsible for these electron micrographs, i give them credit..they are not my personal photos. Images on the right and left are shadowed, image in the middle is AFM.

To create the round “generalizations” of angles in SP-D fuzzyballs, the actual angles were measured in the molecules below.  A mean was obtained for each angle-set: e.g. the center pix had 4 measurements, as follows:  I will measure all 90 images and see if the trend holds.
147.46
127.6
41.62
43.32

SP-D diagrams

I have looked at literally dozens of diagrams of SP-A and they just are repeats of the initial diagrams put out by the labs that investigated surfactant proteins early on. I am assuming the earliest came from this institution, Whitsett’s lab, but I am not going to spend the time to check.  Owing to the basic premise, certainly not unique to anyone in this institution alone, that the diagrams don’t matter as much as the science… i think that the dimensionality of the SP-A bouquet has been lost, most likely due to the lack of care in the production of the “diagrams” which accompany papers.  In fact the angle of the neck – CRD portion of the bouquet trimers has two configurations, open and closed, according to some researchers.  I will post the mean+/-SEM of the angles typically used in diagrams, vs what is actually measured in transmission electron micrographs.

Just a word to those preparing scientific illustrations – one does a huge disservice to perpetrate erroneous diagrams.

While on the topic of diagrams, why on earth do people keep representing the CRD of SP-A and SP-D as ovals, arranged like little tulips. THis is just lazy.  The CRD of both proteins have been so well worked out that from a protein database one can actually provide the entire structure (that is the neck and the CRD) and it looks absolutely nothing like the typical tulip. See a couple tulips below.  They are just not representative of actual molecules.

Surfactant protein D fuzzyballs

I have scoured the literature to find any images, and even diagrams, of rat native and recombinant surfactant protein D, hereafter called SP-D. There are some very nice images (perhaps the best) by Crouch et al, published in JBC, (also using recombinant SP-D) which I have cut and pasted into this video, counting all the trimeric arms with “attached” carbohydrate recognition domains. Crouch et al indicated that about 5% of the structures are multi-assemblies, that is something around 12 arms? or more is what they show. Actually two authors have commented on the fuzzyball rarity in shadowed images for microscopy. Other images came from google searches for SP-D diagrams, and many of these are from McCormack, and from others in the lab here at Cincinnati’s Childrens Hospital.

The three dimensional structure (multimers) of SP-A and SP-D have been shown to be important for function.  Vieira et al 2017“In conjunction, these data demonstrate the critical role of oligomeric  and tridimensional structure of surfactant protein A and surfactant protein D for proper function.” and also say “SP-A and D can target pathogens by simple aggregation, without a direct interaction with the cell. Similar to complement C1q, SP- A can function as an “activation-ligand” which facilitates particle uptake once it is coated by Immunoglobulin G”

SP-A and SP-D have distinct functions though both are quite easily given the “title” of multivalent innate immune proteins.  What is interesting is that under some circumstances and not others, they may adopt a more spherical  and highly oligomerized state, or they may remain trimers, hexadecamers, dodecamers and in lower oligomerization states. For some reason the bouquet for SP-A as an 18-mer is most frequently cited in the literature when in fact the electron microscopy might show full fuzzyballs of SP-A, and other forms (periodicity in flat sheets, under other circumstances.  In the same micrographs of type II alveolar cells, SP-D fuzzyballs really havn’t been encountered, but in vitro SP-D makes great fuzzyballs.


https://thankuscience.com/wp-content/uploads/2018/09/SP-D.avi (cut and paste)  SP-D .avi link

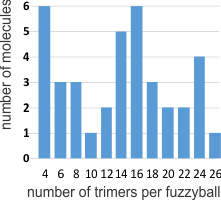
I was curious whether there was a pattern to the number of trimers in any given fuzzyball and for SP-D there were numerous articles which actually had pictures of oligomers.  The number of arms (trimers) for each fuzzyball of SP-D, randomly encountered in publications (not to be confused with randomly photographed under the microscope… as i am quite sure there was selection bias in photographing these) is shown on x axis of this quick summary graph.  Incidence is on the Y axis. I could have counted more (and may do that) in some images where there was indication that perhaps there were arms and CRDs that had been displaced during collapse of the fuzzyball onto the grid. Image below is taken from Crouch et al mentioned above and used without permission.

Here is a short videoclip of SP-D fuzzyballs — you can see where I have counted the carbohydrate recognition domains, as I overlayed them on the existing micrograph with red dots. There are places where I might add or subtract one now and then from what is pictured, but in general you can see that top number is something around 26 arms (each a trimeric molecule) in some fuzzyballs. I think more than 32 (a multiple of 4 is likely) arms in any given fuzzyball is going to be pretty uncommon.  It is very apparent in some that groups of 4 arms persist.  While the orientation of SP-D arms is probably end to end in those groups of 4, I am thinking that SP-A fuzzyballs are going to be four groups of 18-mers. Whether such is found in the literature I will soon find out.

Desmosomes in alveolar type II cells: perhaps not? or if so, not very many!

While perusing hundreds of electron micrographs of alveolar type II cells in half a dozen species i was disappointed NOT to see any desmosomes, or if I saw them they were not very well developed and tangentially cut, but I really think they may exist in a different form than they do, at least, in liver.

This I surmise from the fact that very little of the alveolar type II cell is actually “tethered” to other cells. A large portion (basal plasmalemma) abuts basement membrane, a tiny bit is close to alveolar type I cells, that connection by the way is very thin and would not even provide enough space wherein a mitochondria could reside and be found tethered to a desmosome, if i could find a desmosome. The large (perhaps the largest) plasmalemmal surface is in the alveolar space and no desmosomes possible there.  So the hunt for desmosomal mitochondrial tethers in alveolar type II cells just came up empty. Empty for desmosomes, empty for desmosomal mitochondrial tethers, but of course there are plenty of mitochondria per se…. just not tethered to anything resembling a desmosome.  I don’t even have an image of something which might be considered “close”.

It makes sense in terms of physiology however not to have rigid structures tightly binging alveolar type II cells together…. the tremendous movement within the alveolus durin inspiration and expiration would make it a little untenable to have to use energy, move mitochondria, make and break associations within the cell and the intermediate filaments, and lose the intercellular bonds in the cadherin molecules 20 or 30 times a minute. (and remember that is slow compared to the inspiration and expiration of some animals).  So peripheral lung was probably a silly tissue to hunt for desmosomal mitochondrial tethers (there are other junctional complexes of course to prevent fluid from coming into the intercellular space that are easily seen, tight junctions and adherens junctions. Some describers of peripheral lung epi dont even mention desmosomes. HERE (i have never heard of this journal, so reader beware)

RNP along the inner nuclear membrane

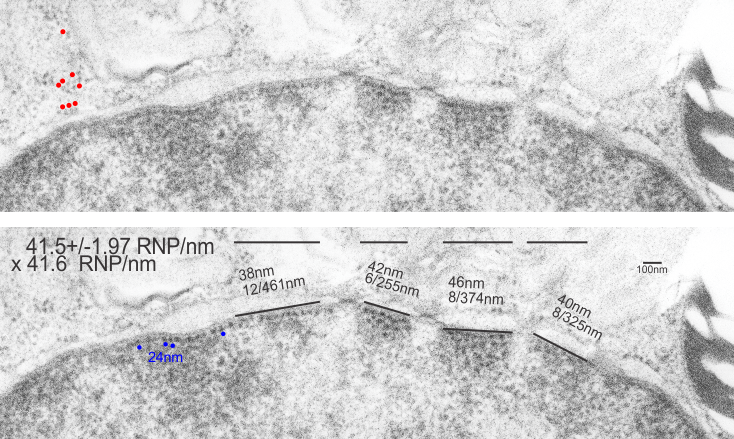
When i encounter electron micrographs where there is such obvious order i just marvel at the detail and complexity of life. Here on the inner nuclear membrane of an alveolar type II cell, in between the nuclear pores, there are little RNP particles, neatly and tidily spaced at about 41 per 100nm, and at about 24nm diameter (slightly smaller than the ribosomes from this same micrograph used at a measure of 27nm diameter. These are organizationally (that is, the RNP and inner nuclear membrane, and the ribosomes on the RER membrane) and with such similar but not identical sizes, shapes and arrangements,  that it becomes almost silly not to see an evolutionary structural relationship.

Picture on top has NOT been altered, but the identical picture on the bottom has had the distinct areas of RNP burned using photoshop just to show you what i see. Red circles are ribosome size, relative to the enlargement of the images (taken at 27nm) and blue circles are RNP granules, which are apparently closer to 24nm diameter. Point here is the rigidity of the inner nuclear membrane, and flexing of the outer nuclear membrane at sites where the ribosomes on the outer nuclear membrane are actively producing protein.

Four adjscent inter-nuclear pore distances have been measured and RNP counted. Mean+/-SEM is given at 40.5 ribosomes/100nm  and all ribosomes together with all nm is 40.6. A tangential area of the inner nuclear membrane and many RNP forming a grid like network is seen about midway-top of both micrographs, but accentuated in the lower micrograph.


Hexagonal pattern in protein granules in alveolar type II cells of the ferret

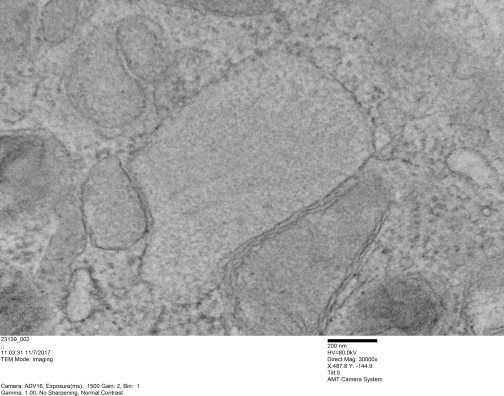
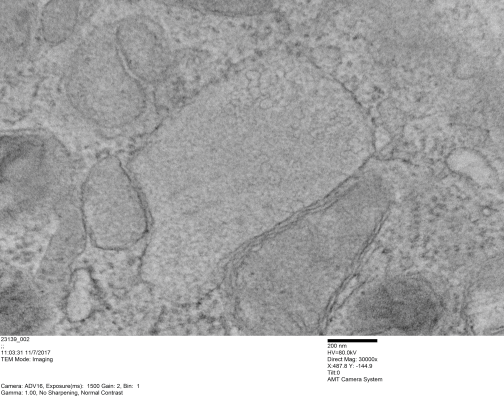
Hexagonal pattern in protein granules in alveolar type II cells of the ferret — yes still working on this. This image is from new sections, new microscope, but the results are the same. Image on top is unretouched, image in bottom i have burned what i see as a hexagonal pattern in this layered intracisternal granule.