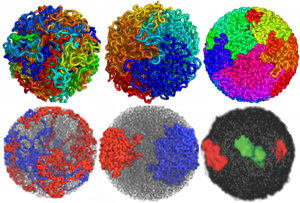
DNA folding: fractal globule and equilibrium globule renditions. What awesome research and a daunting amount of data to handle. I read (or tried to read) one of the original papers by Job Decker and another by Erez Liberman-Aiden but could hardly wade through them. I am linking a blog called Explorable which was easier to read and recaps some of the figures in the original publications.
Altogether awesome, but I struggle that some the images which could actually use real electron microscopic (TEM anyway) structures so show these types of data…they don’t do so yet and there is much that could be revealed. That would be a good way of bridging what is seen with the theoretical. The radial symmetry (on 2D bilateral using TEM) was obvious to me decades ago, not in the interphase cell so much as in the cell undergoing apoptosis… I am so glad this will be the case).
Here are a couple of images which show different models (fractal and globular) for DNA folding, and one that shows the radial symmetry found in the more_transcribed (which i would dare to call euchromatin, and lesser_transcribed (which again, i would dare to call condensed chromatin) regions of the DNA. I had always kind of thought that the active regions would be at the interface between those two TEM visualized domains…particularly at the nucleolus.
What haunts me still is what I saw 50 years ago in tissue culture is the spinning nucleus (time lapse photography), I have yet to have anyone put that into the puzzle, for a motion and distribution to the nuclear pores, of newly transcribed RNA. Certainly that is in the mix somewhere, unlike these static models. Below is a shameless cut and paste of the several images that come up on google for DNA chromatin territories (some fractal globule, some equilibrium globule, far right lower, green is more highly transcribed region of a chromosome.)… AND where is the nucleolus.
