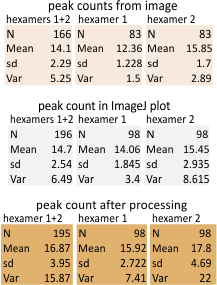
Just to reiterate: these are all values from analysis of a SINGLE SP-D image (noted many times before in this blog). Various methods of enhancing the image for detecting peaks (whether by filters and masks in photoshop, corelDRAW, or corelDRAW photopaint, or Gimp or gwyddion, and several more raster adjusting programs, as well as a few signal processing programs (PeakValleyDetection xlsx, PeakDetection xlsx, Octave (ipeak.m, findpeaks.m, allpeaks.m), there is concensus. IT IS CONCENSUS BY CHOICE. It has to be recognized that the CHOICE, whether of filters and masks in image processing, or functions in signal processing, is mine (YOURS). Peak counts can be manipulated to go from 1 to 40 in both image and signal processing. It requires sensible input from the user. That said – 15 peaks per hexamer looks pretty solid.

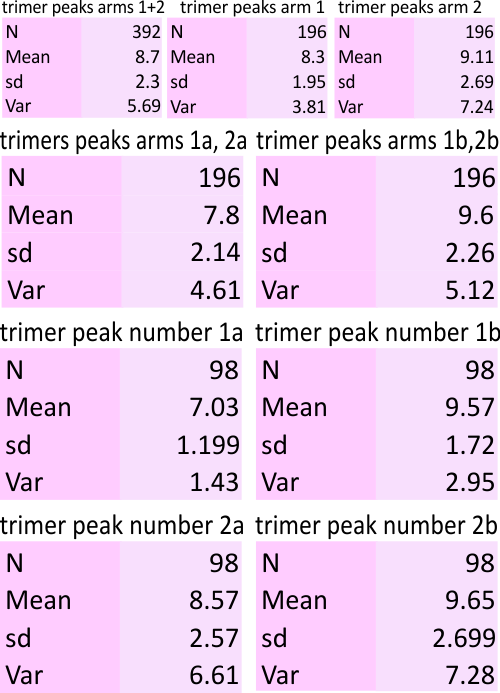
 Here are the N, mean, sd, var for trimer peak counts – which numbers include the processing that has been done so far, so this will change with other variations on the signal processing data. Please note that the complete N terminus peak is included in the counts of every trimer (this means that from the distal edge of the center bright peak to the CRD is what is measured, so counts include the whole N term of the dodecamer as a ONE peak) in each trimer.