Cover submission for two friends at UNC
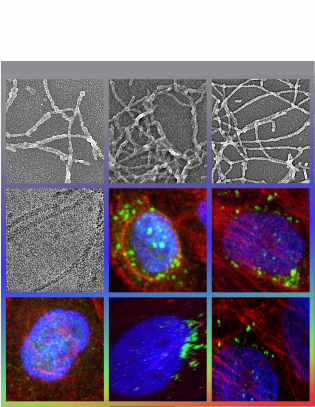
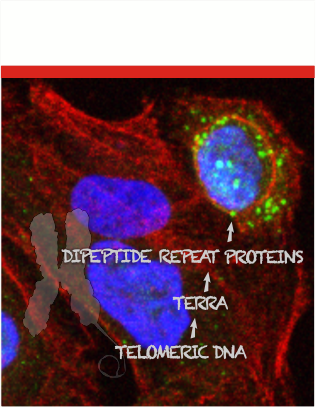
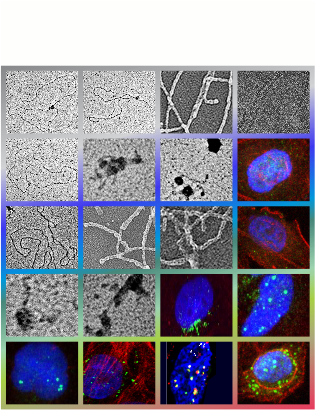
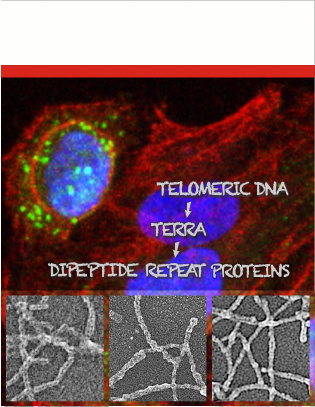
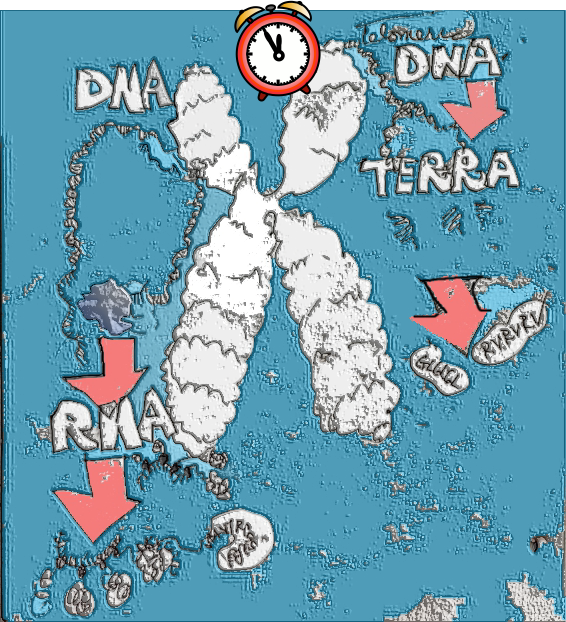
Cover submissions to PNAS for Dr. Jack Griffith’s lab – which sadly did not make the cut. But it is kind of a nice set, so I posted the submissions here.
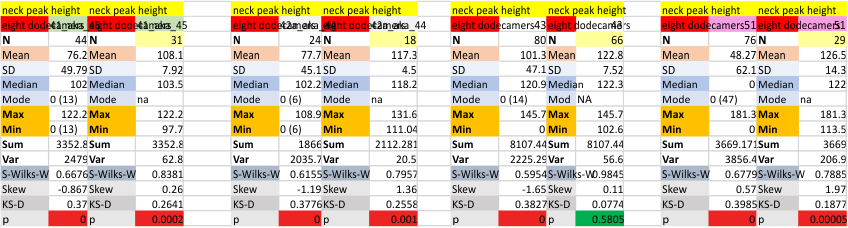
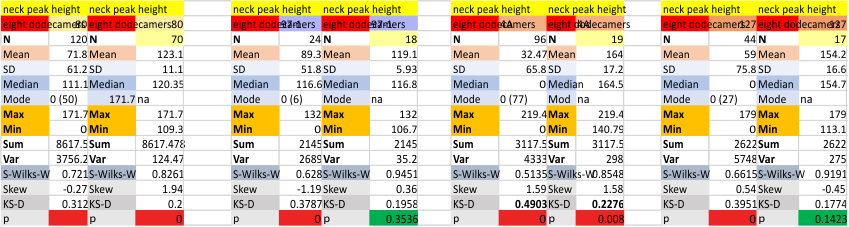
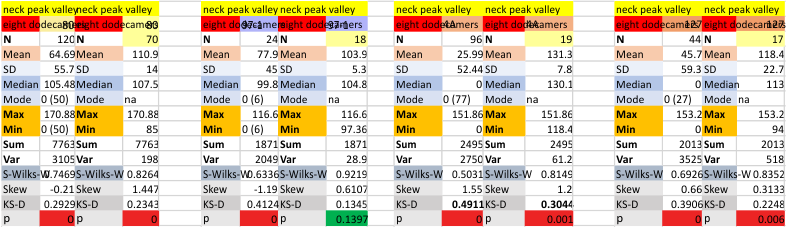
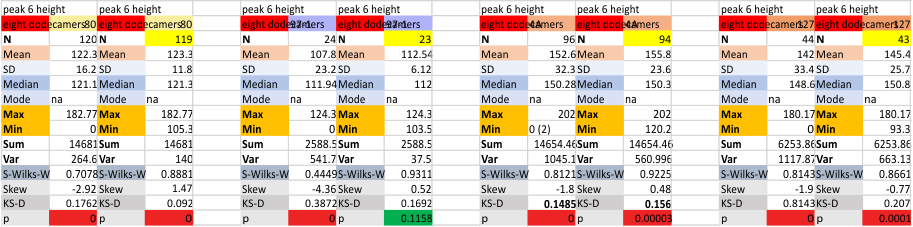
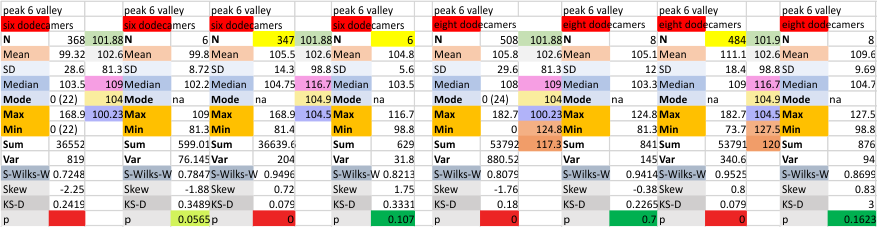
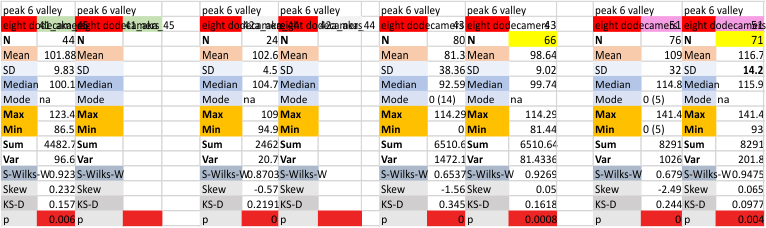
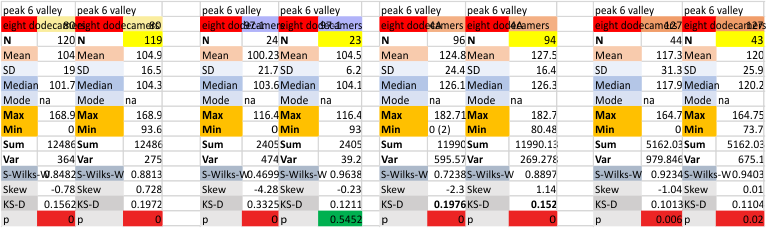
Eight dodecamers: SP-D – peak 6 height and valley
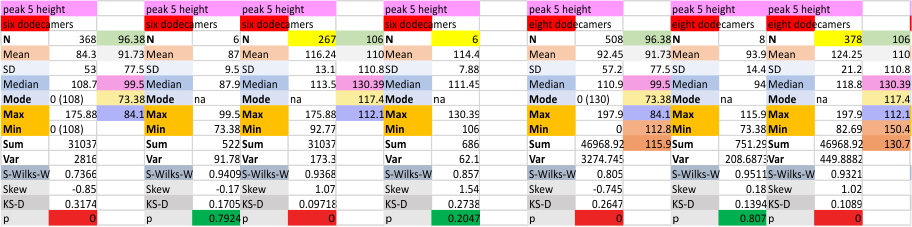
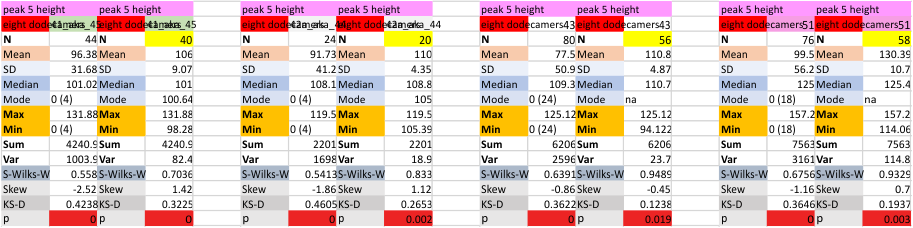
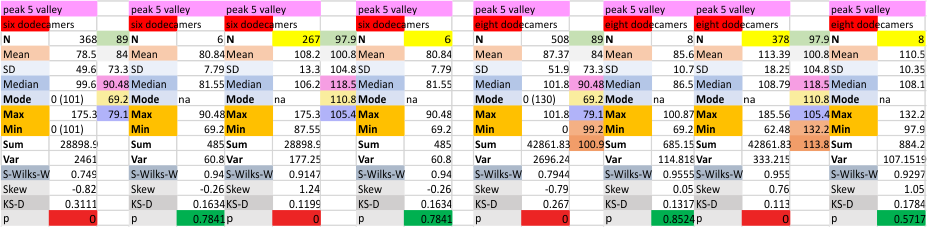
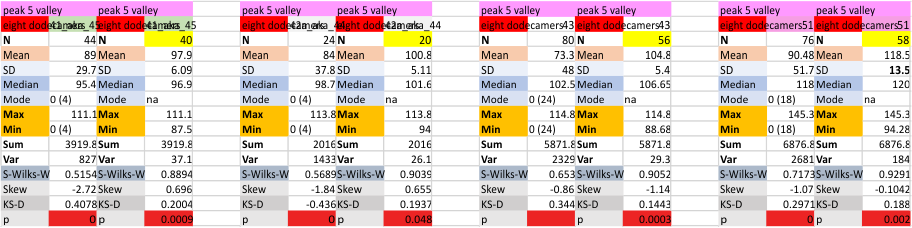
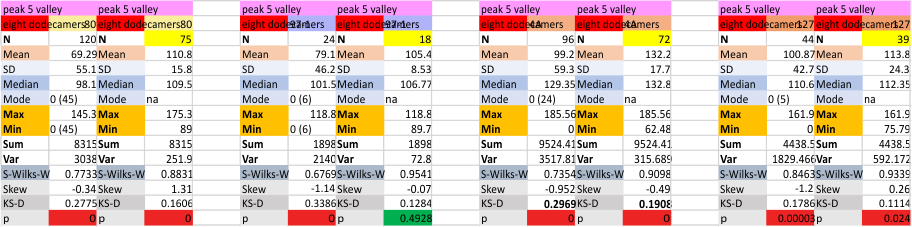
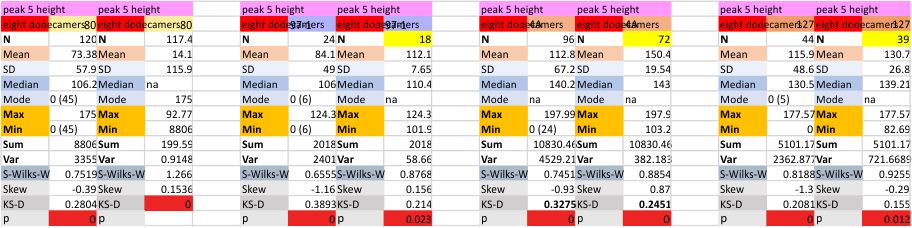
Eight dodecamers: SP-D – peak 5 height and valley

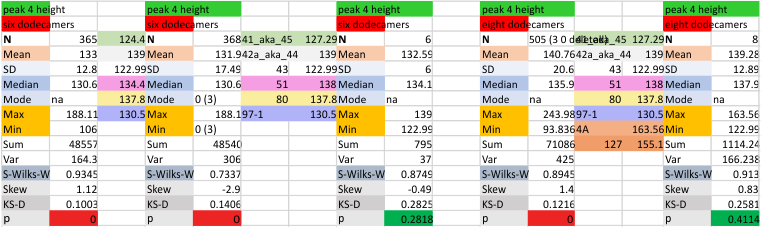
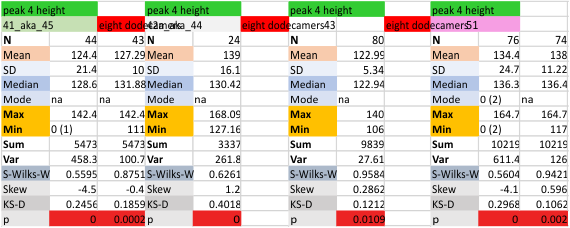
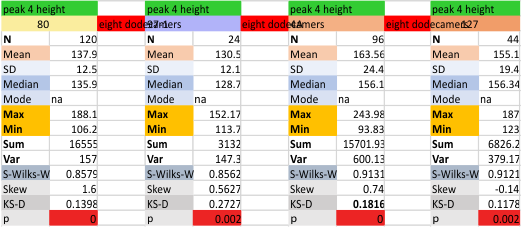
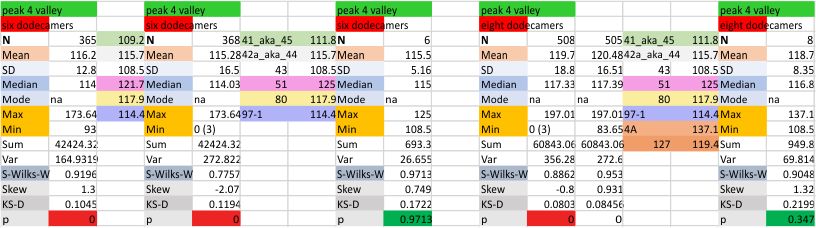
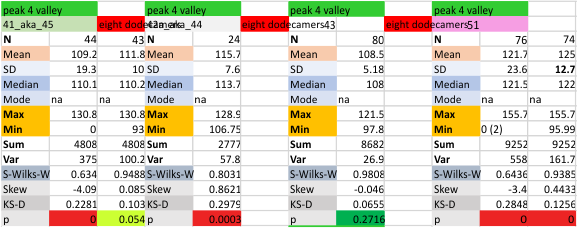
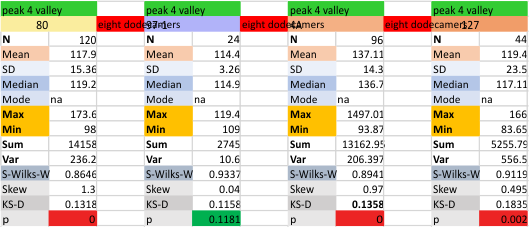
Eight dodecamers: SP-D – peak 4 height and valley
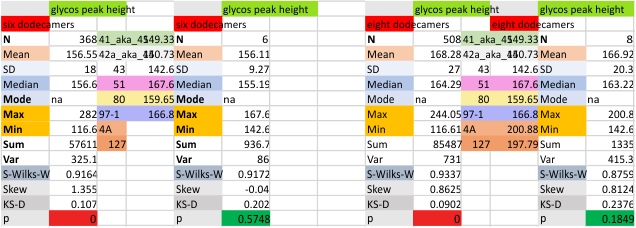
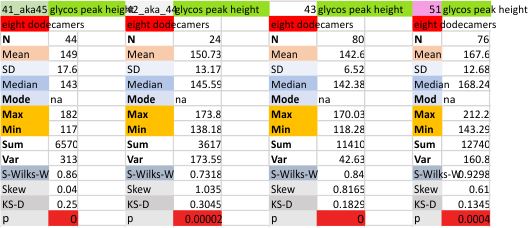
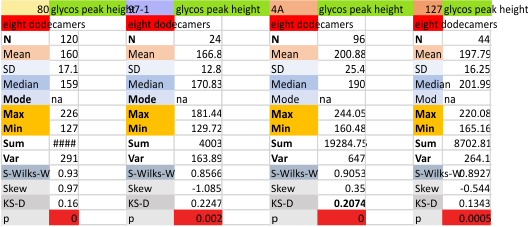
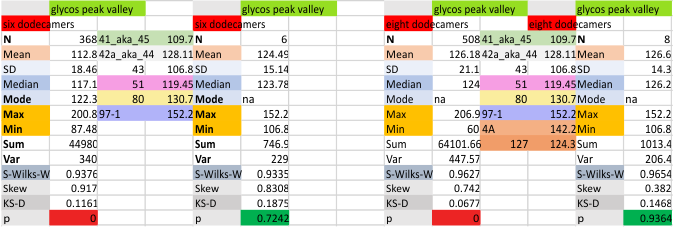
Eight dodecamers: SP-D – glycosylation peak height and valley
Same MO.
peak height
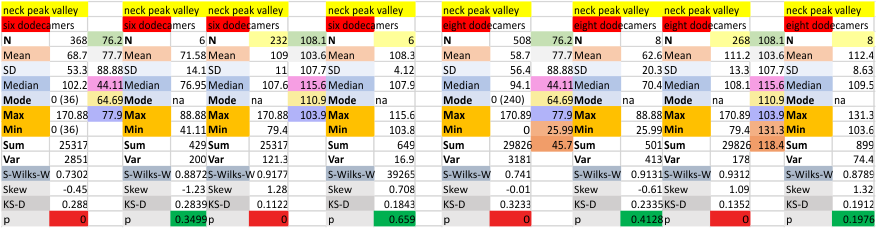
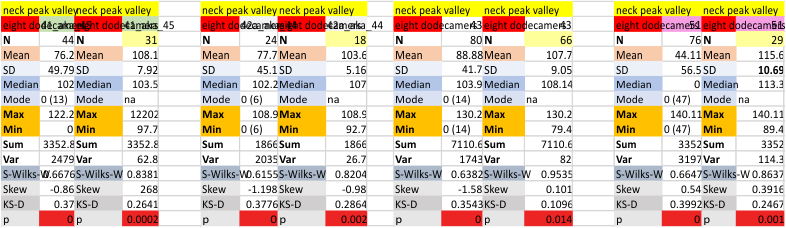
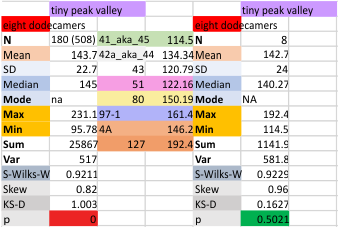
peak valley

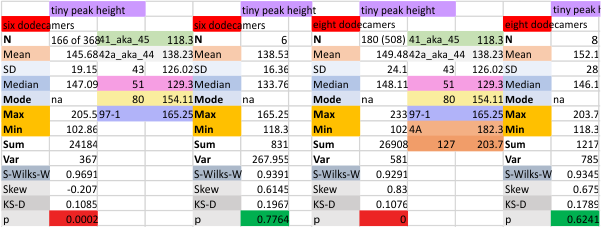
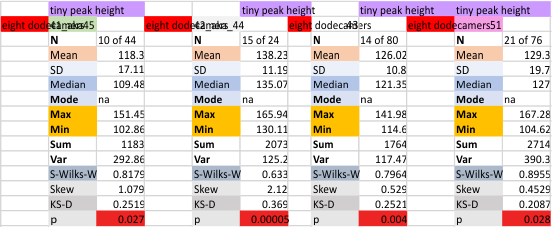
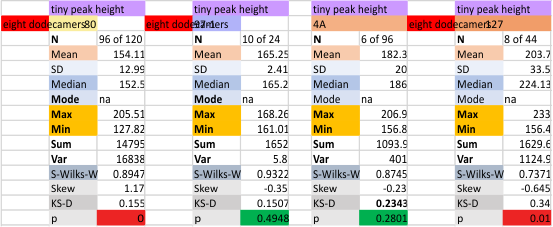
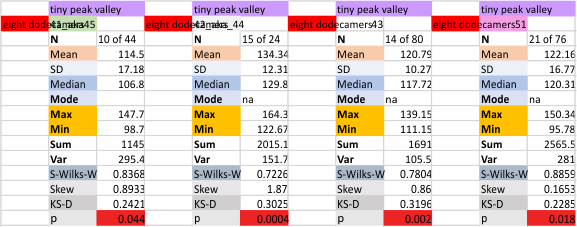
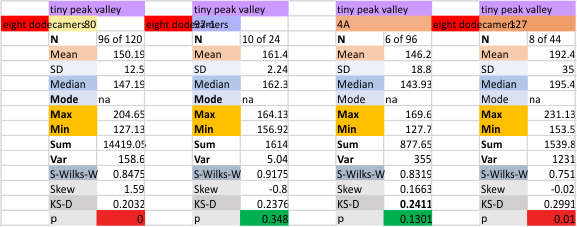
Eight dodecamers: SP-D – tiny peak height and valley
same mo.
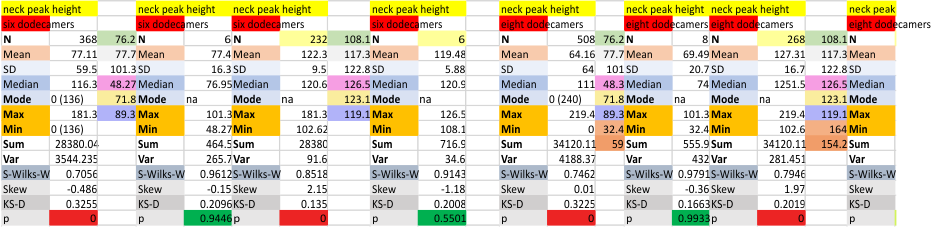
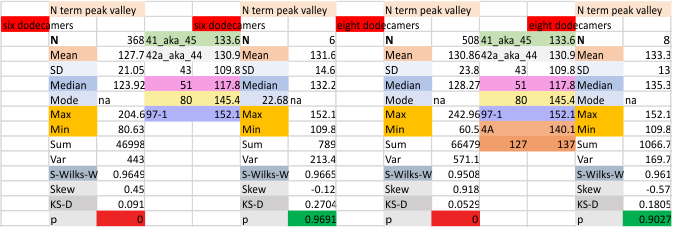
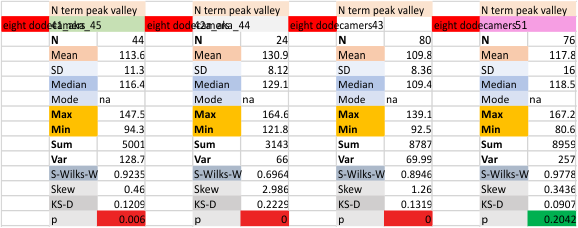
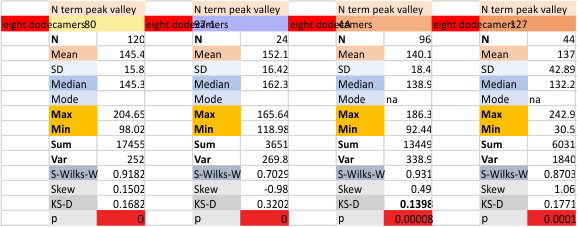
Eight dodecamers: SP-D – N termini junction peak height and valley
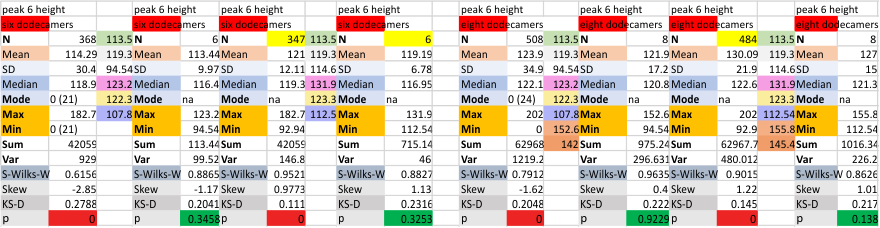
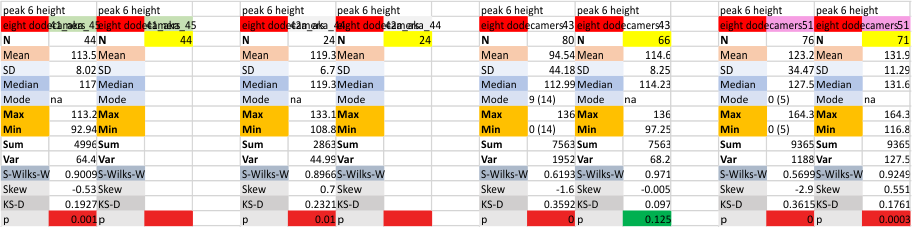
Peak height (grayscale values) for all plots of trimers from 8 dodecamers of SP-D. Mean peak height for the N term peak is something around 233nm +/18nm.
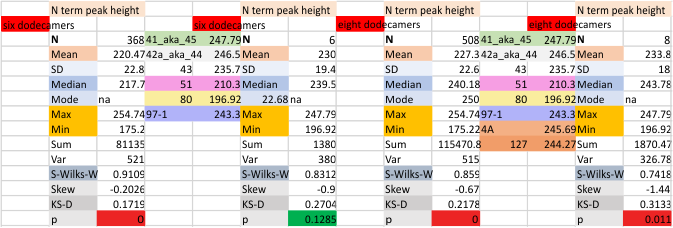
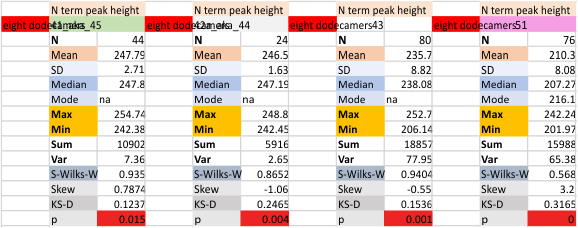
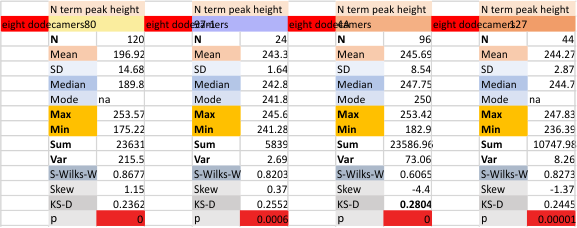
Lower images are peak valley (grayscale 0-255, values plotted in ImageJ)
Eight dodecamers: SP-D – N term ?x subpeak height
There is often a slight decrease in the N term peak, likely where the N term domains join the trimers at the center of the dodecamer. This is an infrequent event and its detection is also related to how one draws the plot line through the center of the image of the molecule. When the N term peak width is listed there are occasions when it interferes (reduces) the total N term peak width. The tiny change in grayscale (height and valley) of the N term peak is pretty small. I have put a ? in the title of this peak to denote its inconsistent appearance.
It is nevertheless listed here in a graphic and below, it appears in two of the eight trimers in these data.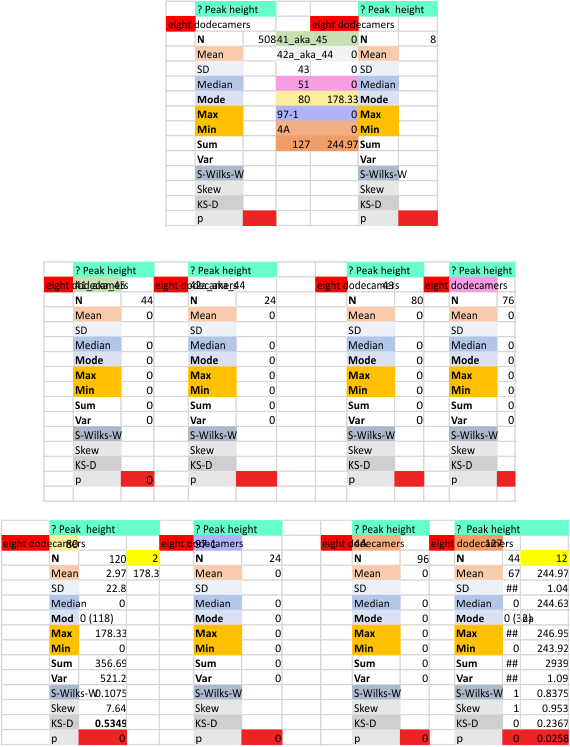
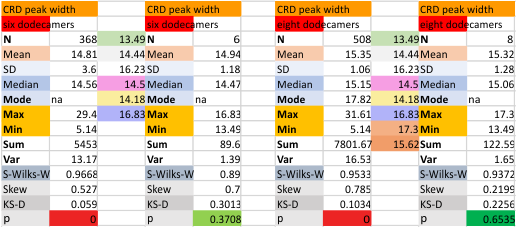
Eight dodecamers: SP-D – carbohydrate recognition domain peak width
Same MO, but since this peak appears 100% of the time (so far) there is no second column where the mean (and other parameters) is calculated excluding the missing (undetected) peak values. Difference in CRD peak width is certainly not very different from the first 6 dodecamer summary than the first 8 dodecamer summary. Some benefit is gained by using the means of each, rather than the individual trimer values.