Same MO.
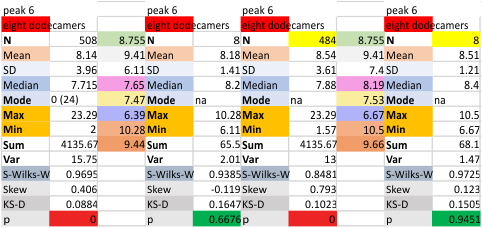
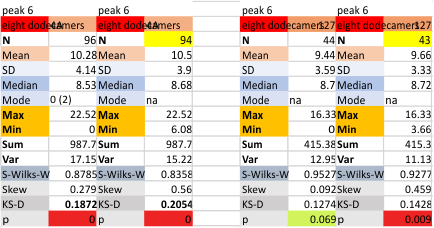
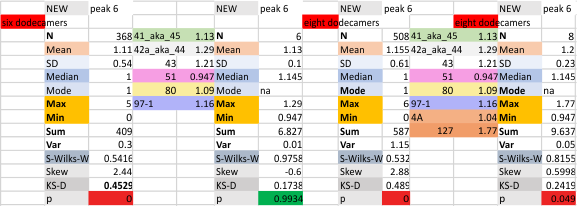
Eight dodecamers: SP-D – peak 6 width
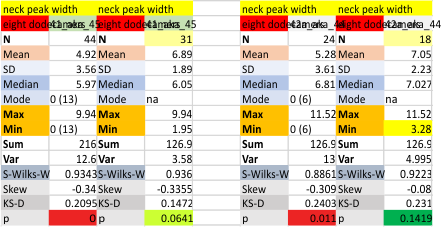
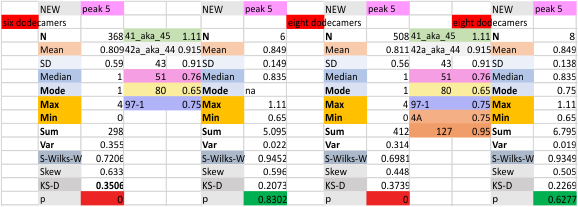
Same MO as previously . In my own observations I have seen this broad low peak as a consistent feature, perhaps more consistent than peak 5.
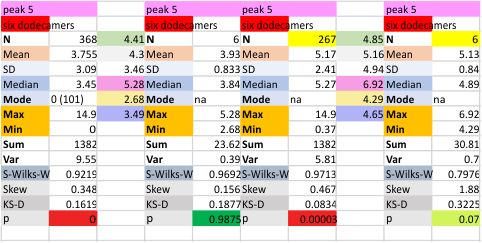
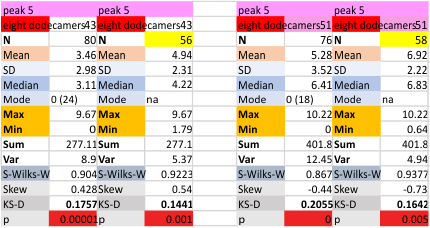
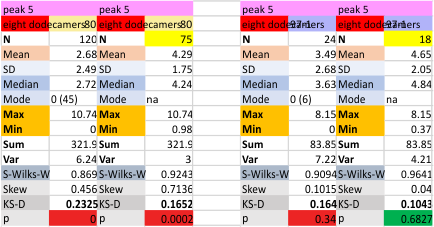
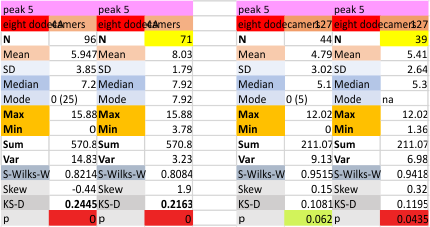
Eight dodecamers: SP-D – peak 5 width
These data were derived using the not-detected peak values (listed as 0s) included in the whole sum, and also with the not-detected peak values. Those data without the missing values are indicated with a “yellow” color in the cell.
I am actually glad that the data dont change much regardless of whether it includes the 6 dodecamers, or the 8 dodecamers, or the missing values, clearly the data are pretty stable.
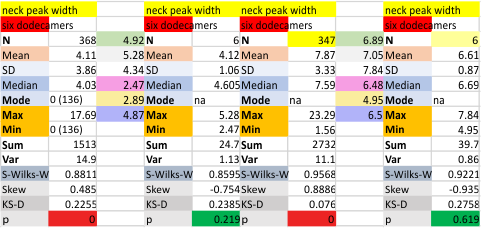
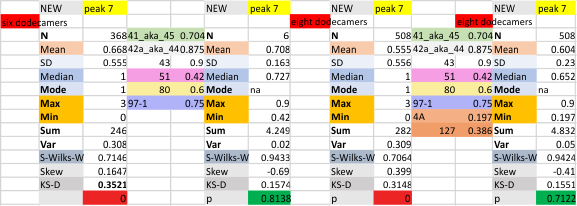
Images below (top two image are the summary of all the trimers counted (six, and eight trimers). Peak 5, (color has been pink in every post for the last two years) is a thin and low peak which is present in Values include each trimer plot as well as the dodecamers as single entities (n=6 and n=8). 72.5 (six dodecamers) and 74.4 % (eight dodecamers) of the time, peak 5 is detectable. A nice round number for the width of peak 5 is 5nm.
Each dodecamer is treated separately and data are listed below the summary tables.
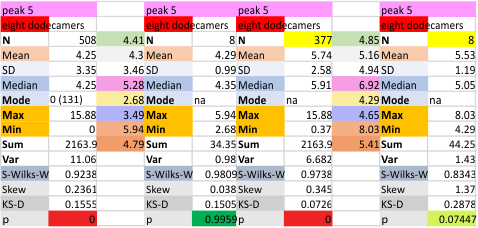
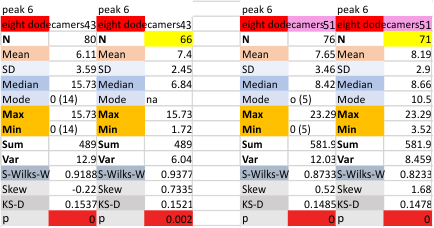
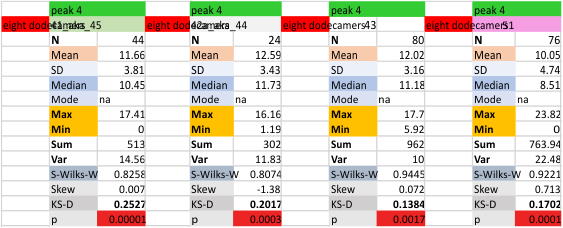
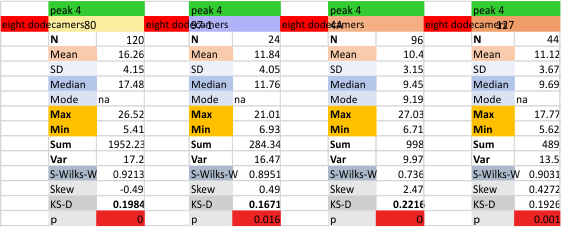
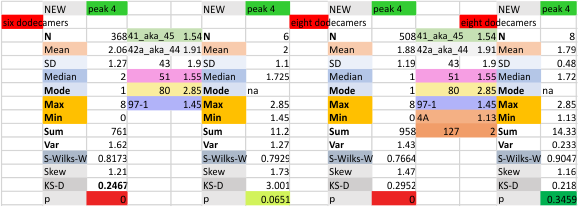
Eight dodecamers: SP-D – peak 4 width
As Before. Peak 5 is adjcent to the glycosylation peak, and often seems to be a little less high, and a little less broad.
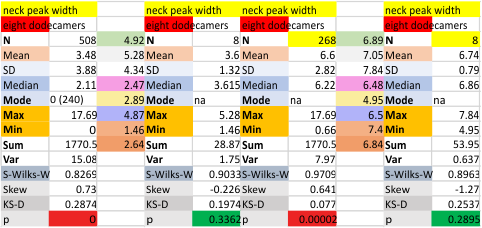
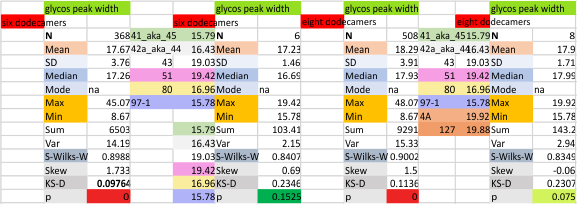
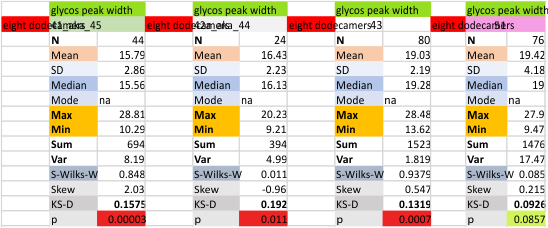
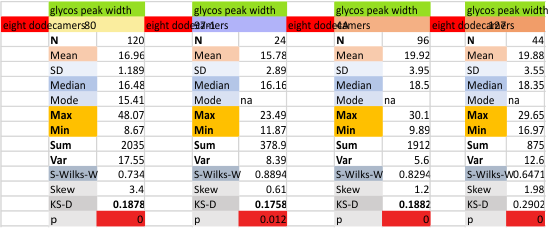
Eight dodecamers: SP-D – glycosylation peak width
as before, mean is in nm as determined from the micron bar in each image. So the glycosylation peak seems to be just about 18 nm in width, as shown by measurements on the first 8 dodecamers (AFM images plotted in IMAGEJ, with images subjected to many different filters, and plots subjected to many different peak finding programs.
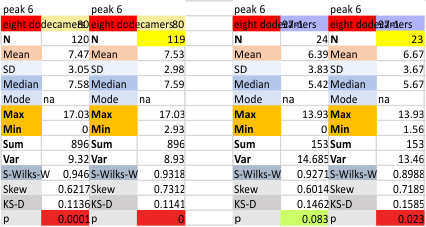
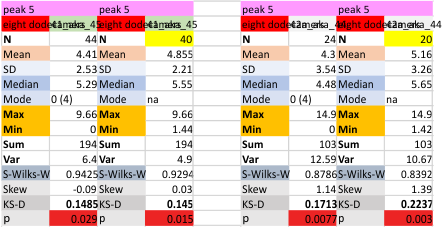
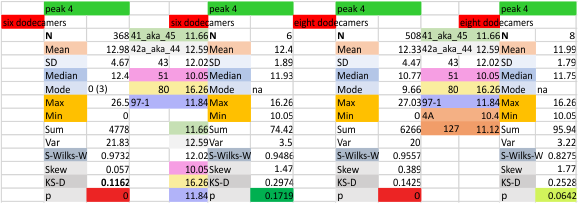
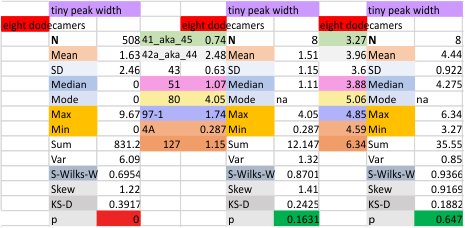
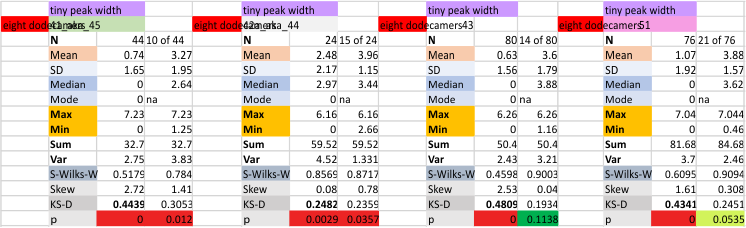
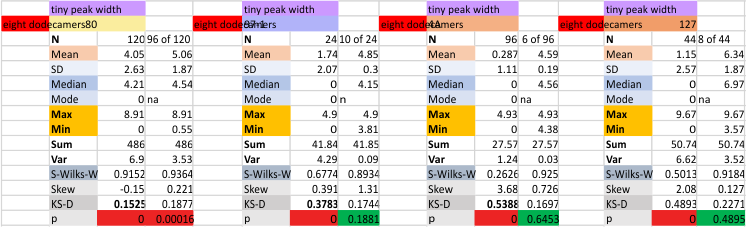
Eight dodecamers: SP-D – tiny peak width
Same modus operandi. Peak width might be just between 4 and 5nm +/ 1nm wide when calculations are made without the undetectable peaks. Measurements of just the peaks that appear will be done henceforth.
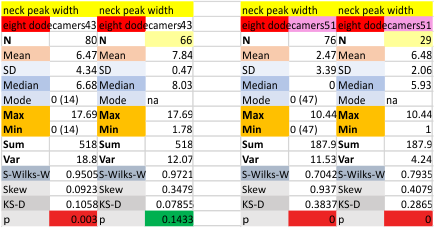
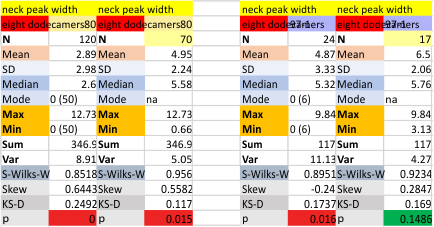
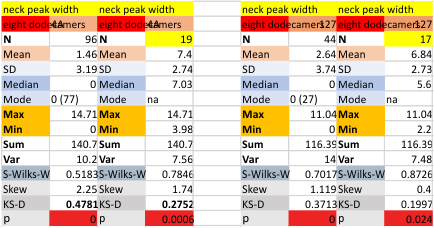
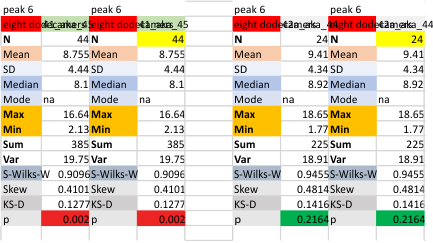
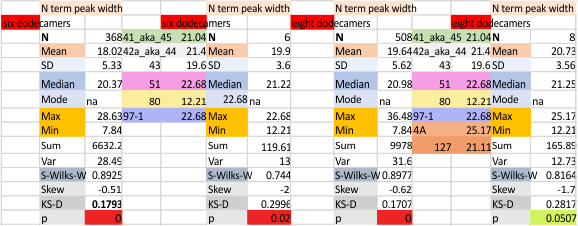
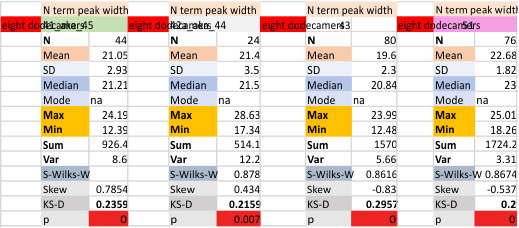
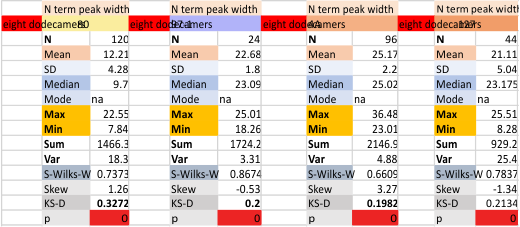
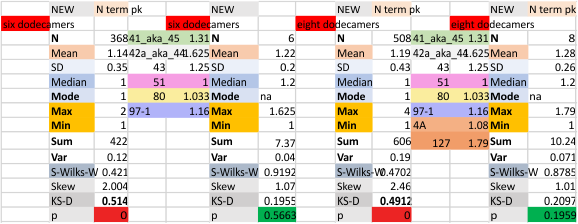
Eight dodecamers: SP-D – N termini junction peak width
In this assessment of N term peak width, two new sets of measurements have been added. The caveat here is that both the image I have labeled 4A (supplement figure 4, image A from Arroyo et al) is also the image that I have named 127 (from the body of the paper, thus a different resolution, different bar marker, different ppi, and different contrast and HSL, image processing filters, (but NOT different peak finding apps). These are sort of used to compare differences between random image factors (you can make your own comparison just by looking at the statistics for 4A and 127 in the figures below). A two-tailed t-test determines: The t-value is 6.57159. The p-value is < .00001. The result is significant at p < .05 between the two sets of data. They are not out of line with means for N term width for other N termini peaks.
Means for the N termini peak of n=six dodecamers, and n=8 dodecamers is the top figure. And individual dodecamers are listed in the two figures below (by the names I have given them, and also color coded).
Sub-peaks found within the “reasonably well documented” 8 peaks per SP-D trimer
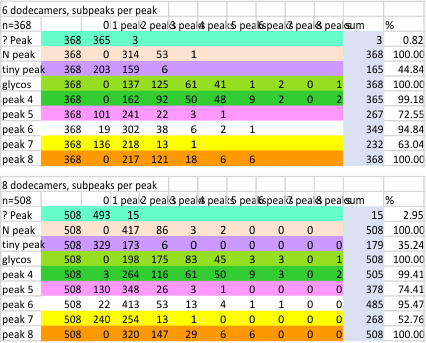
These data show the number of smaller peaks within the tracings of SP-D trimers (using AFM images from various published papers). At this point they are all rhSP-D images. The trimers are plotted beginning at the most complete side of the N term peak. This means that the whole N term is plotted (and it includes the N from the adjacent trimer(s) that build a dodecamer. All these plots are from dodecamers. This link is to a summary of the number of sub-peaks.
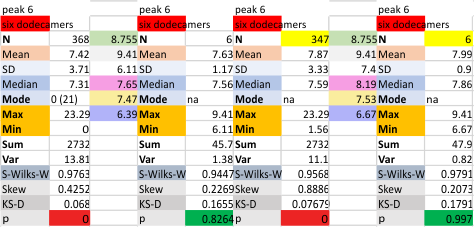
It has been my observation that the multimers of SP-D with higher than four trimer arms often show a decreased brightness within the center, and many images confirm this. In this series of plots there are just a few images where in a plot of a hexamer, there is a small peak in the center of the N term peak. I have labeled it the ? peak, and it is shown below in light bluegreen. It doesn’t occur often but enough to mention it. All the data are organized similarly. On the far left is the sum total of peaks from six hexamers (n of trimers =368 which includes gray scale plots from many signal and image processed images, so on the very left, no division into dodecamers is made, but the column just to the right of that has six dodecamers where the mean occurrence of peaks is found where the N=6. On the right hand side of the data, far right, the same has been applied to 8 dodecamers, and just to the left of that set of numbers is data for each individual trimer, and n=508 plots.
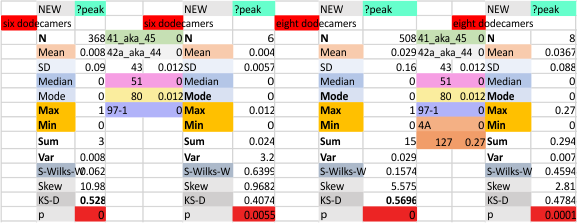 While signal processing apps have determined that there are likely 15 peaks per hexamer, this number does NOT include the ? peak above.
The 8 peaks per trimer (N peak is counted once with each trimer, but also counted only once with each hexamer) are as follows:
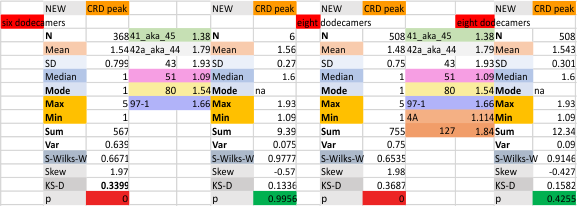
N term peak, tiny unidentified peak, glycosylation peak, peak 4, peak 5, peak 6, coiled neck peak 7, CRD peak 8, and are labeled like this below. The means are the number of sub-peaks per peak. The three confirmed peaks (in the literature are N, gly and CRD, the neck peak 7 is inconsistent because the CRD domains obstruct it often. Peaks that are NEW, and as yet unconfirmed are tiny peak (2), peak 4, 5, and 6).
The N term peak has been organized with the mean of the sub-peaks per N term peak plotted from the same trimers as above. And so on, for each of the peaks — as listed above.
The glycosylation peak is apt to be not just one peak but two (and my thought is because each of the trimers can by glycosylated individually, and the coil of the trimer ofsets each of those sub-peaks. Those peaks composed of more than one sub-peak are the glycosylation peak (peak 2) and an as yet undescribed peak 4 which also has two sub-peaks. The CRD domain is subject to a different type of flopping around, and does not show two peaks consistently. This is likely affected by the fact that a plot line goes through the CRD often not picking up the apparently random order that the CRD domains of the trimer fall during processing. 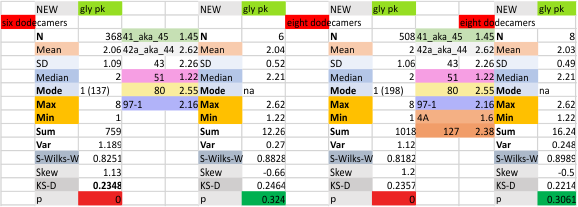
Obvious Truth
There must be an afterlife
Because this life sucks.
said with all due respect to the eternal, mm
8 dodecamersL SP-D: Subpeaks per peaks detected using AFM images of surfactant protein D.
8 dodecamersL SP-D: Subpeaks per peaks detected using AFM images of surfactant protein D. (APOLOGETICS) Always and at the outset I thank Arroyo et al for the 2020, 2018 publication of the SP-D AFM images (the best I have encountered of SP-D), and secondly I thank Dan Miller for the scipy app for peak finding, Aaron Miller for the LTI app for peak finding and batch processing, and Thomas O’Haver for his help with Octave, and excel templates, and also for ImageJ and Gwyddion (and I guess i should be very grateful for the original developers of CorelDRAW (which was Kodak)(not the new owners as they get a thumbs down from me), and also the original producers of Photoshop (yep, version 6 on CDs performed just as well for image analysis as rented versions of 2021 (so it is also thumbs down to them)).
The following is the result of 508 image and signal processing plots of 8 images of surfactant protein D. These data are reported as individual plots of hexamers (thus four trimer plots (as separate entities, with plots beginning at the full width of the N term plot and progressing to the CRD. I have made the assumption (which I will discuss) that signal processing algorithms are smart enough to see symmetry… bilateral symmetry, which apparently is giving that AI too much credit.
Notwithstanding that problem, the total number of peaks per trimer (8) established some time ago is the number which is used to box the number of subpeaks into 8. Below are the data for 6 dodecamers (n = number of plots analyzed, not the number of dodecamers analyzed) and 8 dodecamers. Consistency is apparent. Not all peaks show up 100% of the time. Peaks such as the N and glycosylation and peak 5 and CRD peaks are often lumpy (meaning they have subpeaks.
There is a peak called “?” which only rarely occurs in dodecamers (but in my opinion is frequent in multimers (called fuzzy balls) and is indicative of a side to side N term association among molecules. It is reasonable for that peak NOT to show up below.
The N peak is present 100% of the time, as is the CRD peak and the glycosylation peak (though the height of the glycos peak varies (and at this point unglycosylated AFM images of SP-D have not been analyzed, so that will be dependent on the SP-D molecule, which species, and mutations and other factors, but here it is rhSP-D). Peak 4 is very consistent, present 99+ percent of the time, not previously reported, lying in the collagen-like domain. The next two peaks have characteristics that are obvious visually, peak 5 is not wide, and is not tall but consistently shows up right after peak 5. Peak 6 is broad, and appears regularly (94+ percent of the time, and is also low. Peak 7 is what I believe is the neck of the SP-D trimer, and it is very often covered by the bright peak of the CRD (and this depends on whether the rounded ball shaped CRD peaks are positioned directly over the neck or to one side. (Just my opinion here). The glycosylation peak and peak typically have more than one subpeak.