12 dodecamers of SP-D: tiny peak width about 4nm

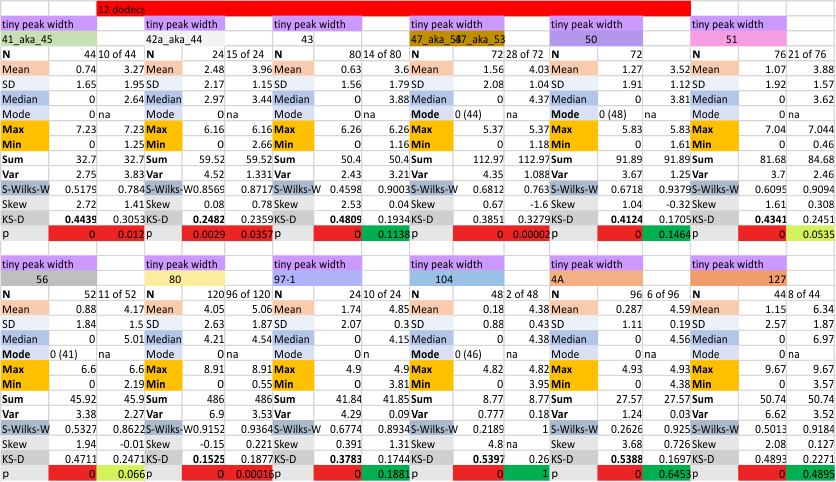
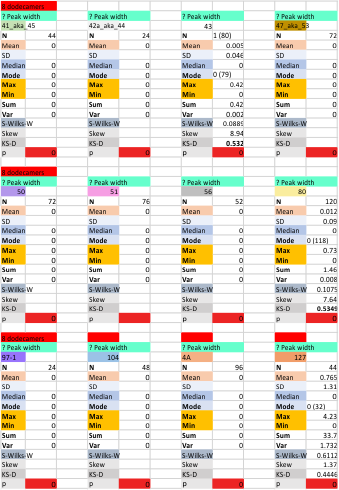
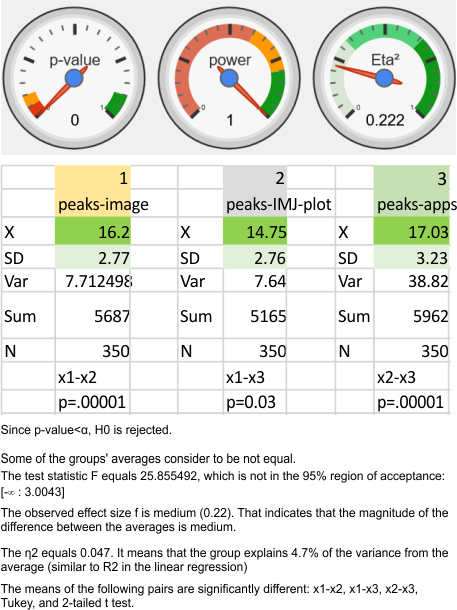
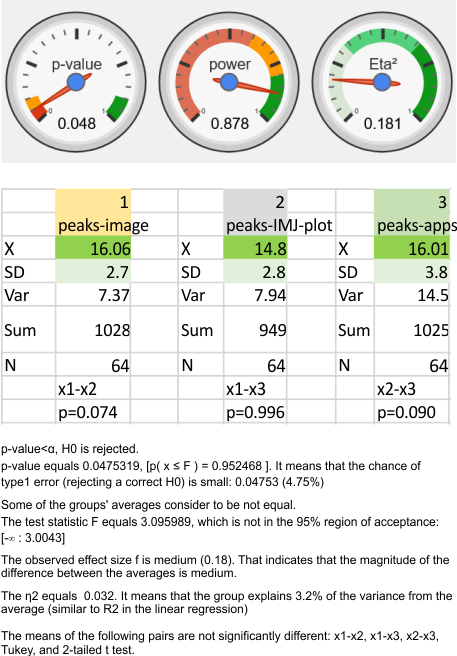
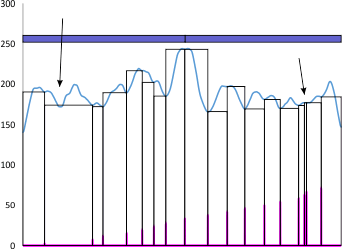
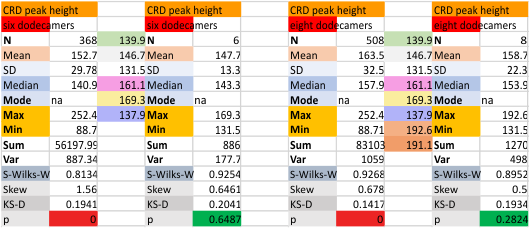
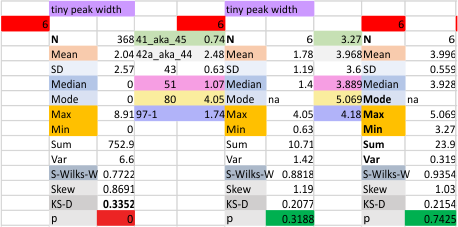
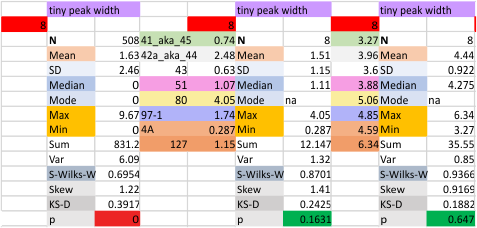
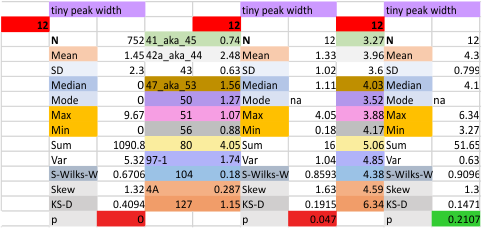
The “not always” found tiny peak on the downslope of the N term peak seems to give consistent data, reagardless of the fact that it is often not detected as a peak by signal processing or even image filtering techniques. I have seen it in images too many times to ignore it. It lies just between the N term peak and the glycosylation peak in surfactant protein D dodecamers (AFM images, by three researchers in three separate labs). It would be prudent to subject trimers to peak analysis to see if it is seen at the same frequency or whether it has something to do with the N term junctions in surfactant protein D multimers.  So images below show means and other statistical info for analysing the tiny peak width, left hand columns, using all non detected values, right hand columns “NOT” using the missing values.   The addition of 2 and then 4 more dodecamers to the list of those measured follow below in the same organization.
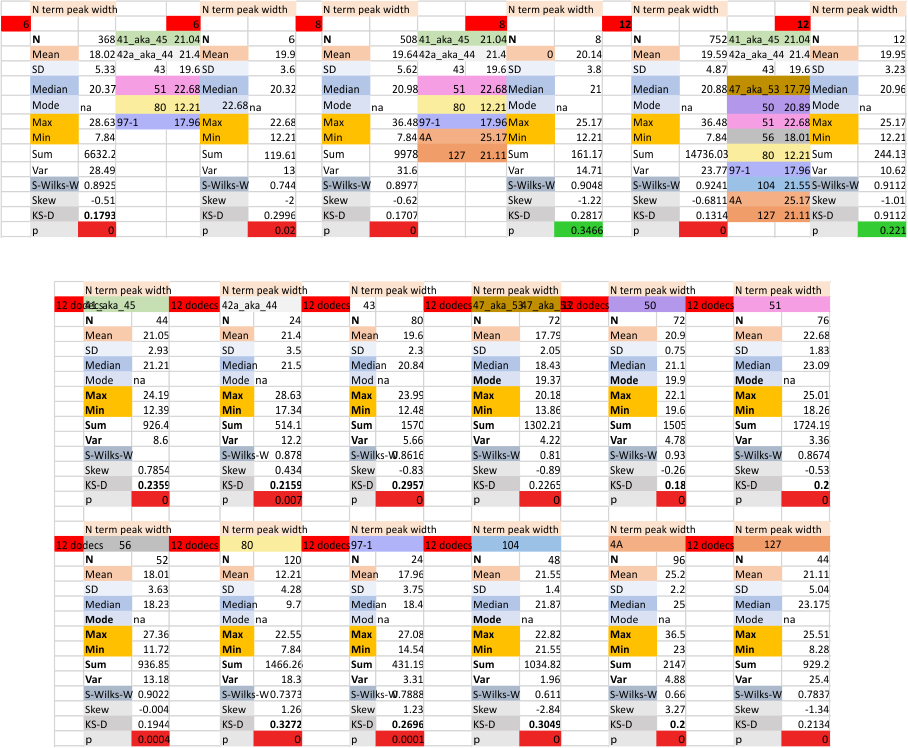
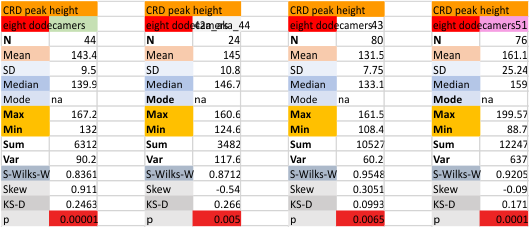
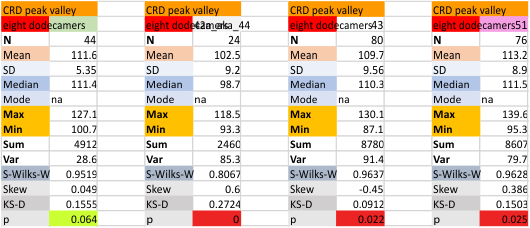
individual data below —  sometimes i find an error, and correct it… so there will be tiny discrepancies between this list and previous lists, but so small as to create little change in the data.
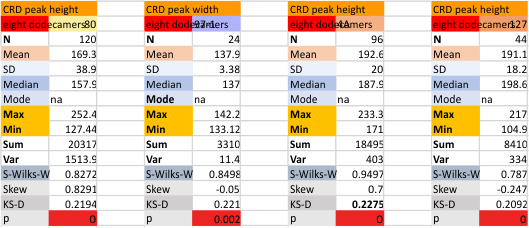
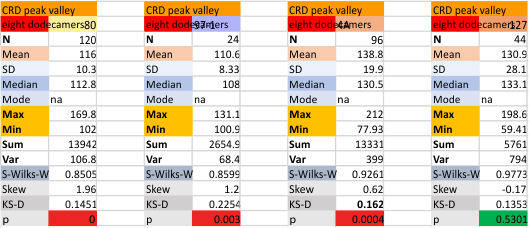
12 dodecamers of SP-D: N term peak width about 20nm

THis number has not changed in two years.  20 nm found in a primitive way of analysing, by hand, using image processing filters, and signal processing peak finding apps…  I am admitedly the common factor however the distance is now just really not going to change.

the whole group of statistics, individual measures of N peak width, and the sum of all the trimers (N = 752) and just the 12 dodecamers as individual multimers (N = 12). A few numbers have changed with finding errors, again, making little to no difference in the mean.

12 dodecamers of SP-D: N term inner peak width – that is, the tiny peak that sometimes occurs within the large prominent N term peak.

It has come up in many discussions how the N term peak in surfactant protein D may have a dark center, and this is particularly evident when one looks at the AFM images of multimers of more than just a few trimers. Some multimers actually have a deep empty center. Only in a few dodecamers is there a sub peak in the large, prominent peak for the N term junction. I looked for that indication in all the plots of the hexamers so far and it shows up very infrequently, and the data below just sort of negate that inner subpeak as non existent. It may be highly infrequent in the dodecamers, but it is not that infrequent in multimers, and thus anytime it shows up in a dodecamer becomes important in considering just how the N term domains fit together in the multimers, and if in fact they can fit together in more than one way. So the data below is pretty uninteresting, but the image and the plot (image is 2D fast fourier tranform in gwyddion. The peak detection is made in Octave using ipeak.m M80 as the settings. Coloration of the peaks in the plot are a choice that best fits the mean number of peaks per hexamer — which was determined to be 15 (see previous data). Top image is the AFM micrograph, image filters and signal processing for plot peaks.
Mid N term peak width (N=752, trimers plotted)(N=12 dodecamers (two hexamers, four trimers).  Data below also shows each individual dodecamer…. and as mentioned, most don’t show a peak in the middle of the N term peak.

ANOVA: peak counts using images vs apps

Nice online ANOVA caltulator (i like the colors and graphics especially, even though I have not ever tried to grasp statists).  To me it looks like there are significant differences between what “I” see initially on the image, what “I” count as peaks on the plots generated from the images in ImageJ, and what the various signal processing apps that detect as peaks on those same excel plots.  Top image. These data are for all 14 dodecamers, the most current set of peak counting data so far.

When I separate out JUST MY peak counts of the images (before and/or after image processing filters) and then just MY counts on the initial plot images in ImageJ, and then my recounts of the peak separation when adding up the sub-peaks into the preset 15 peaks (found previously by an average of hundreds of plots)…. I personally am  pretty consistent in how i see the peak number in each image.  Bottom image.

“peak” or not to “peak”

This is an example of why i get frustrated with peak detection apps…. vertical axis is grayscake 0-255, x axis not numbered is nm (which I have to calculate against a bar marker on the original micrograph) and is not really relevant here.

Peaks that are found are clearly marked at the point of valleys on each side, by the program (it is an excel program called PeakValleyDetectionTemplate.xls) and what this smooth function (smooth 11) thinks is a valley is highlighted in pink…. so i didn’t miss anything…. or add anything.

My draw program has a “snap too” function that snaps to the valley lines detected so I don’t even make the judgements in identifying those vertical valley indicator lines there so this program measures width between peaks with the lines (which I colored pink) and are easy to follow. BUT…

My ADDED arrow on the left points to a peak that I certainly would have called a peak that was not detected by this app, my added arrow on right points to a peak that I certainly would NOT have called a peak which this app thought was a peak (I could not even find a drop in grayscale of one single pixel).

Just out of wanting to know the facts in this study of SP-D, and trying to help determine the structure of the common multimer of SP-D (the dodecamer), I dont change those chosen valleys from the apps, I just report the results whether I agree with them or not. But sometimes these apps “think” (lol) too hard about lag, threshold, smooth, incidence, width, deviation, and influence etc…. and gloss over the obvious, not able to consider chance, inherent variability, possible radial and bilateral symmetry etc……..therefore at this point they are really not as good (in the method that I am using them) as human judgement (mainly mine ha ha ha) in my humble opinion. I also accept that this is a simple molecule, bilateral, with maybe 11-17 peaks routinely found. So its not a massive chaotic mess, but sometimes they just dont work.

Verge of a Dream: Anything I ever wanted

Another train will
Roll in, I won’t
think it is me
missing you.
When you were
In a curtain of
Silence… with me
Thinking and feeling
But a tag along of
No importance,
Instead
You had planned
without yourself in
The picture only for
me, unexplained and
luckily unexplainable.
Not making up
for a wrong
but like a surprise party
That, that day gave me
Anything I ever
Wanted when
The dream the
Night before
Had said I was
All alone following
Invisible
Behind someone
Who had jumped
The turnstile into
Lives they
Are lessening
by their presence.

RLB 03/17/2023

recycle reuse respect reduce refuse reclaim repurpose refurbush replenish react reassess reaffirm

recycle reuse respect reduce refuse reclaim repurpose refurbush replenish react reassess reaffirm

OK, you get it,  it is the universal  ‘RE‘ principle —  is REquired for a sustainable world-culture:  Here are 11 REasons to think about tomorrow with the today’s earth in mind.

refuse products packaged in non-recyclable containers

recycle everything possible, including left over food in composts, leaves, twigs and branches, dead houseplants, etc

reuse everything possible, even if it is to be used for something other than it was intended (use common sense)

respect the environment – it is the only earth we have at this time

reduce purchases and frivolous wants and trips and dumb stuff, you dont need a bigger TV or new phone if the old one works

reclaim areas of concrete, blacktop, unkempt public land for green zones,

repurpose clothes, and posessions for other uses, eg, clothes shaped into rags, shoes into highways,

refurbush what you own, rather than raze and build new

replenish areas depleted from misuse and misguided utilization with green space

react  to violations in clean air and water legislation from corporate greed

reassess your habits and determine areas where you can be more effective with purchase and waste control

reaffirm your commitment to NO single use plastic containers

I don’t understand

I don’t understand these three critical things:

1. how my children are at once my greatest pleasure and greatest pain

2. how i can have so many ideas and not enough years left to work on them

3. how i can neither love nor be loved

Eight dodecamers: SP-D – CRD peak height and valley

These data are the pretty final. The next dodecamers will be added as individuals only, not as the sum of the long list of plots (e.g. 508 trimer plots) but using only an N of a dodecamer (which seems to me to produce the best data. None of these data have had the  width measurements standardized to a trimer length in nm (which will be done last).  I guess it is possible to standardize the grayscale values as well.