same MO as before,


same MO as before,
same MO as before.


SP-D peak widths, heights and valley values for four dodecamers. These are the data for peak 5. (count begins with peak 1 as the N term peak and moves toward the CRD, each for trimers.
 When there are peaks which are “not detected” a value of 0 was used, and data were plotted both ways, i.e. with the non-detected and eliminating the non-detected). The pattern was applied to all peaks as one dataset, and to individual dodecamers (N=4) – see bottom image.

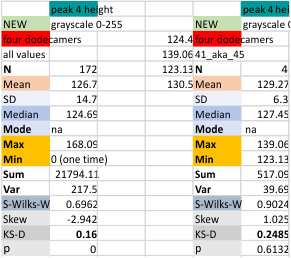
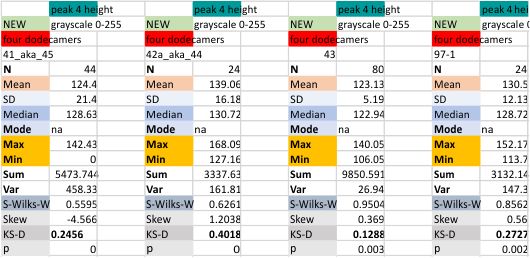
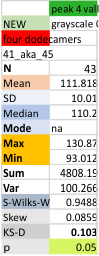
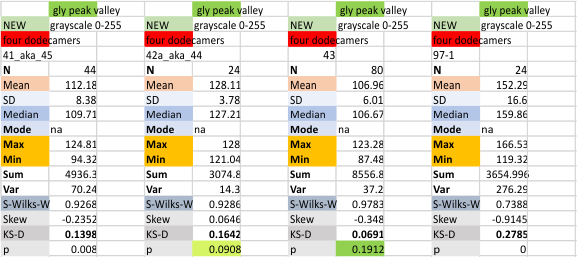
The peak just lateral (remember going to the right and the left of the N term peak with peak 1 being counted as the center N term peak), peak 4 is a very consistent finding with image and signal processing. You can see top image shows that only once in 172 plots of trimers was there no detection of peak 4. Means and other data are shown both ways. The image just below that is the mean grayscale valley value for peak 4, calculated as an N of the number of dodecamers examined, and the N of plots is not the same in the dodecamers, but each dodecamer is given the same weight in those means and SD. With and without the single missing value in one dodecamer, means are very close, that is grayscale value of 112. The third image down shows the mean grayscale value for the peak 4 valley for each of the four dodecamers individually (these were used for the means shown in the second image from the top). Lastly the single dodecamer where a single peak 4 was missing is shown at very bottom).


Grayscale values(0-255) the y axis. Glycosylation peak was detected by image and signal processing algorithms 100% of the time, so there is a single value recorded for the valley (immediately lateral to the “tiny” peak – keeping in mind that this molecule has bilateral symmetry beginning in the center at the N termini junction peak. so many images of this molecule have been posted on this blog that they shape of the AFM images is easy to see.


The peak height has been found, the valleys on the side of each peak progressing to the center (inward sid of the peak, coming from the CRD toward the center, thus the right hand side of the left part of the image, and the left hand valley side coming from the right CRD meeting in the center where the N term peak is.
This means that each trimer valley value is taken from the side directed toward the N term peak As recorded for widths and peak heights, the valley height is measure in all the separate trimers (N=172)(N=4).

Plots of SP-D trimers (as hexamers) with the N term peak becoming a whole peak (not just a half peak as the molecule would suggest happens..this done for ease of calculating thus each shows 15 peaks per hexamer (an odd number) or 8 peaks per trimer. Using many plots ( grayscale plots obtained in ImageJ), peak heights are being determined for each peak set, and these data are for peak 6, as yet unnamed but present at least 90% of the time in this dataset — 100% of the time in the plots for two molecules, 95% in one molecule, and 82.5% in another). Using just the summaries for the four dodecamers (without the missing values) the peak height for peak 6 is 115+/2.6 Screen prints from excel are below.


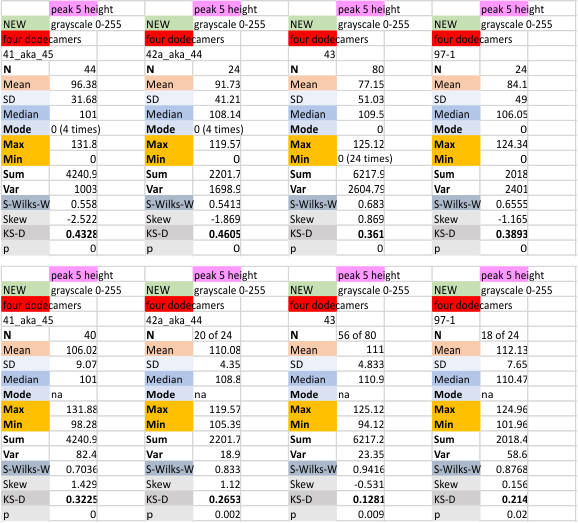
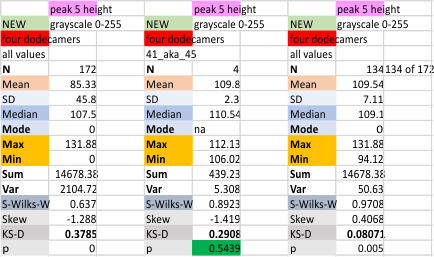 Peak 5 is a very consistent low thin peak that follows after the broad peak adjacent to the glycosylation peak. See previous blog entries for position and width of this peak (which I have always (at least 99% of the time) given the color code of bright pink. First set of numbers calculates parameters WITH the missing values as 0. second (far right) set of parameters is calculated from all plots in this dataset but WITHOUT the missing values as 0, they are eliminated. Plots below the top image are those two variations (with (top row) and without (bottom row) missing values), for the four individual dodecamers studied so far. The best data comes from using the N of four, mean peak 5 height from each of the dodecamers. Measurements are grayscale 0-255 on the Y axis.
Same format for peak height as other peaks, and this peak is just lateral to the glycosylation peak in SP-D, when counting begins at the N term peak.