All posts by thankusc

Verge of a Dream: Nothing new

We don’t need
anything new.
Like an undated picture,
you in my arms,
that dress passed on
to your sister.
And that you
would stay
is gone too.
We didn’t need
to talk further.
Stopping in china town
for dinner.
You on my arm,
the late bus
passed on by,
like clouds that
you made disappear.
We never grew older.
You had your arm
round me,
over my shoulder.
Heroes honored
this weekend.
There’s nothing
to change.
I just spend time
Reminding myself,
how the words
that I am yours
are a memory
that has left too.

RLB 09-06-2022

So here is my “real” question

In my last few years, where should I focus my efforts? ?? On the ultimate fate of humanity, the planet, the cosmos ???

Should I continue working on surfactant protein D???
Should I continue to make patterns for stained glass???
Should I help people make memories with trinkets???
Should I work on my yard till every weed is gone and leaf is in place???
Should I focus on my house (like patching what needs to be patched, or upgrading etc…)???

What will have the greatest impact?

I am not at all concerned what my kids get in inheritance, I think getting money from parents does them absolutely NO GOOD whatsoever.

The things that interest me “mentally” are helping to figure out the structural model of SP-D because it gratifies my sense of feeling “smart”… which is stupid…

I get real pleasure out of making patterns for contemporary glass crafters from old and wonderful architectural stained glass, so they can replicate, at lest in part, old designs for their own homes and inspirational places. One of my “road to damascas” desires in terms of trying to give this back to todays culture.

I get pleasure from making mosaic planters and pots out of trash (how that happened I have no clue)

I get NO pleasure from customizing patterns of pets and humans but that is actually where PDQpatterns makes most of its $$,

I get pleasure from keeping my yard, but not keeping it to a painfully manicured state, just better than the neighbors, LOLOL, no really, I try to make it as annoyance-free to my visual brain as possible, and that is hard enough work.

I feel obliged to keep my the yard at my daughter’s residence (really its my yard) as tidy as possible given how few hours a week I am there, and i do this for the neighbors…

OR IS IT complete hubris to think that what I do matters at all, in the grand scheme of the cosmos. “who gives a flying rats behind what one does with one’s last 15 years” and “that is perhaps the only acceptable answer”

And whatever I do (as I realized back when Sadam Hussain lit his oil wells on fire during the Gulf War? of which I was reminded by Putin setting his gas reserves on fire”..(both idiots) I can’t undo those, or any, irresponsible acts, by them, or by me, or by anyone.

I could strive to do the best for the environment, humanity, and give everything until I die and it would make no significant difference.

Does this give me license to “do what i want”????

THE KEY PHRASE FROM MY BF… “make a cosmic dent”  
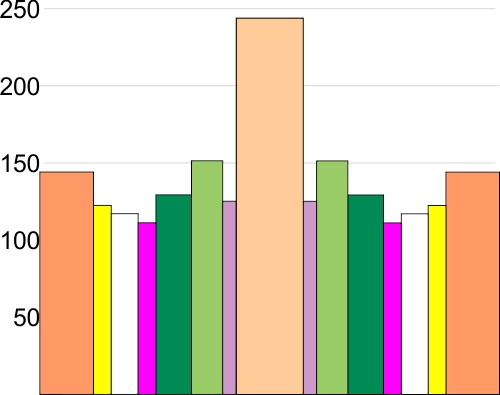
Four dodecamers of SP-D, summary of peak number, peak height and peak width for 300 hexamers

Here is a plot of the height and width (summary of 600 different plots of SP-D trimers)

I have sorted the plots by hand into the “mean number of peaks per hexamer that was found for this same dataset”  So you see 15 peaks, you see the fifteen divided (mirror on either side of the N term peak (peach), tiny peak on the downslope of the N term (purple), peak =glycocylation peak (medium green), peak 4, unknown peak, large, and also wide (dark green), unknown small peak (peak 5, pink ), unknown low and broad peak 6, (white),  and peak 7 likely the neck domain of the hexamer (yellow), and peak 8 the CRD (orange).  This is the a mirror (n=300 plots) of the left and righ trimers (n=600). X axis is percent of width, Y axis is grayscale value 0-255.

peaks along a plot of SP-D hexamer, made with ImageJ and published AFM images of surfactant protein D

The images exported from gwyddion were not included in this dataset because of the huge difference in the grayscale values for images exported R vs RGB when plotted in ImageJ).

Peaks within each of those peaks is shown here.  The peaks which are not present all the time have a value less than 1, those with a value of more than one often have more than one peak as sorted above.  List is for a trimer…. begin in the middle of the above graph, and move to the right (and mirror to the left from the N term peak).  This means that a minimum, there are five consistent (not the published three) but five peaks found all the time. That is the widths… peak 1 (N terminal domain 26nm), peak 2, unknown peak (3nm), peak 3 (glycosylation peak 10 nm), peak 4 (undetermined function, 12nm), peak 5, undetermined function (4nm),  peak 6 (undetermined function 7nm), peak 7 (likely the neck domain that sometimes is seen sometimes covered by the CRD (4nm) and peak 8 (carbohydrate recognition domain (12nm).However, I am doing more valley determinations to provide a “background” or “baseline” for the peaks which will likely NOT be a straight line and may give information on the “slope” of peaks.


Images processed with limit range filter — and resulting grayscale values

I am pretty sure this is just because exports from gwyddion are the R of RGB images,  any help coming from the community that uses Gwyddion is welcome. It causes some problems when using ImageJ plots of the gwyddion exported images and images exported from other image processing programs (as in every other program i have tried (about a dozen).

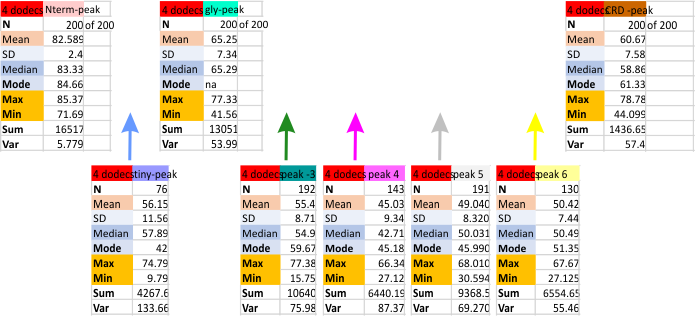
I found the peak heights using just the images processed with gwyddion, in particular the limitrange filter as a separate data set. Results are below. It is clear that the three peaks which have been published (N, Gly, CRD) per trimer are present 100% of the time (in this case, all 200 of the 200 trimer plots. There are two other peaks (peaks 3 and 5 which occur because of their characteristic shapes….  they were easy to recognize.  That is peak 3 which was at least a broad as the glycosylation peak, but usually lower peak height, and the broad flattened peak (peak 5) also low on the grayscale. These were present about 95% of the time.  The peak that sometimes shows up (most likely the coiled coil neck peak is peak 6 and depending upon the position of the CRD, it shows up, or doesnt show up (likely covered by the ability of the CRD domains to land in different positions during processing.  CRD does appear as one, two or three separate bright areas at the C-term end of each trimer. This also makes it a “choice” where to draw the segmented line that becomes the grayscale plot in ImageJ.

These data are for images processed in Gwyddion, and peak numbers (see previous posts) are determined mostly in several signal processing programs (Octave, PeakValleyDetectionTemplate xslx, a LagThresholdInfluence plotting algorithm, and scipy peak detection algorithm).

Sorting peaks into the peak numbered from N (peak-1), tiny peak (peak-2), glycosylation-peak (peak-3), unknown peaks, 4,5, likely neck region (peak-6) and carbohydrate recognition domain (CRD peak 7)  is done manually.

Means and other values prepresent grayscale (0-255). Three highest peaks (top row of values) are those that have been consistently reported in the literature.  Potentially additional peaks are the 5 boxes below.

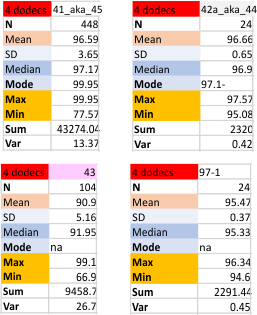
Four dodecamers of SP-D

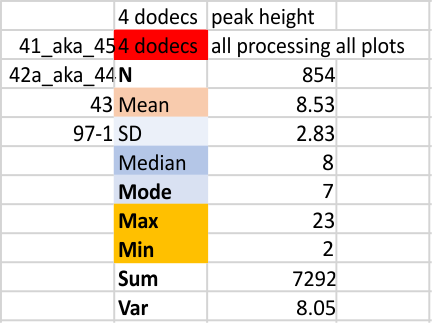
Finding peak height with all the various image processing filters and signal processing algorithms has been time consuming.  I think there is one filter which will always have to be analyzed initially separately.  That is, the limit range filter that gwyddion uses, and that also occurs in other image processing programs (i used it just twice in GIMP).  The peak height for the N term (center tall peak in each hexamer) is highly significantly reduced when the limit range is used.  All other processing filters and algorithms seem to produce a relatively even group (when Y is normalized to a percent).  Initial data of the comparison is below.  You can see there is one value (max 101) which i need to find. There are no perfect datasets, but the shere number of plots represented here means finding it will do nothing to change the outcome.

Here are each of the four dodecamers (traced as two hexamers).

Verge of a Dream: You better get a lesson –

You better get a lesson
From up that hill
From up that hill (refrain)

It all came down
Came down on me
May still come down
On you too
Still come Down
on you too

refrain

Wrap your body up
Flake’s not cold but
Won’t be one alone
Look up that hill.
At a million coming
down

refrain

What someone wise said
Wise for sure
You better better
Take what happened
To me, see that
See all that
try to listen well

refrain

It can’t be easy
Whether you make
The bread or find
Yourself in line.
Its just the same
whether
a common
bramble vine or
a soul divine.

refrain repeated

RLB 08-09-2022

Four SP-D dodecamers: more plots use to determine trimer and hexamer peak numbers

Previously counted plots included all that were available at the time (found in this link; which had about equal numbers of plots from each dodecamer (hexamer – trimer). The data on this page show just about every plot that I have ever made….. these are divided as to trimer…. so this is mean trimer peak number. The latter counts the N term peak with each trimer (even though it is shared between all the trimers…. each trimer it gets counted once.   Therefore a peak number of 8 per trimer would become peak number of 15 per hexamer owing to the N term peak being shared.  In terms of progress…. its best to assume that the more recent posts are the better data.  Every possible image and signal processing filters and algorithms are summed here. Some people counts, all counts….  this represents a huge N, in my estimation.

I think my current favorite image processing filter is still the gaussian blur, and my favorite peak counting program is PeakValleyDetectionTemplate.xlsx by Thomas O’Haver.


Peaks per hexamer were calculated four ways.  As every plot made for each of these four dodecamers. This includes hundreds of counts for one dodecamer, and between 26 and 50 hexamer plots for the other three. Certainly one carries more weight, or one would think, but the data using each of the plots separately is not different than using each of the methodologies (at an absolute minimum there were 2 image processing filters, and at least 5 signal processing algorithms for several of these image processed pictures.

Data are also given with each of the four dodecamers individually: (41_ak45; 42a_aka_44; 43; 97-1).  In addition. n, mean, sd, and other parameters were calculated from my original peak counts from just the “image”, as well as from my original peak counts from the plot generated in ImageJ.  This is in addition to the whole lot of plots subjected to signal processing.    Bottom line is that signal processing appears to increase the peak count in a significant way. Whether the signal processing is “better” (which i dont think it true” or counts from images is “better” remains to be sorted out.   Below is a comparison of the various “sorting” that I used to determine mean number of peaks per hexamer of SP-D.

Two left columns are: 1) Every plot of a hexamer separately, 2) Plots divided into each of the four dodecamers separated into groups; Two right columns are counts separated into  “image with signal processing” per dodecamer ( and separated again into, my counts of image processing plots only plus my counts of the peaks in plots made in ImageJ (that is… NO SIGNAL processing)  18+ peaks with signal processed plots, and 15+ peaks using my hand counts.  15 peaks per hexamer is in my bet for the best number.  See previous posts here.


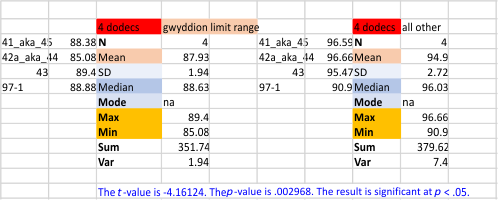
Comparing just the means of the four dodecamers I have plotted many times, there is still a large difference found between those images processed with a limit range by Gwyddion, and all others (lumped) processed by many many different image programs and filters. Someone else can investigate and suggest) whether this set of filters should be included anyhow. How many times the plots of images using gwyddion’s (or any) limit range filters should be included in the dataset or excluded…any choice I make will be arbitrary – and the change in the way ImageJ plots maybe inherent in the app… and not for me to figure out. Peak height in all Gwyddion processed images vs all other is shown below.

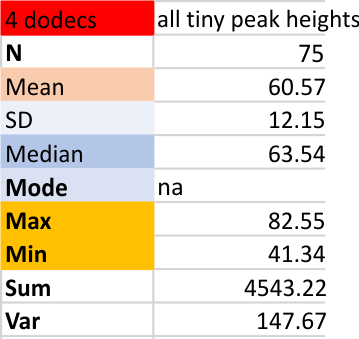
The smallest peak that I see, which is on the downslope of the largest peak (N termini junction peak in the center of the dodecamer) and is very often missed by the signal processing algorithms… thus not all signal processing programs identify all the time (75 times out of 200 plots). the “tiny peak (one occurs on both sides of the N termini peak) has a height “relative to the N term” shown below.   The value of 60 is percent of 100 percent, where 1-100pc = 0-255 grayscale units.  This small bright area along the arm of the molecule is NOT seen on all four arms of the dodecamer consistently, but it occurs at a frequency that made me take notice, and that i can identify often enough to consider it something to investigate.   Summary below is taken from four dodecamers (16 trimers, 8 hexamers, four molecules) of SP-D. The signal processing here has been done on images to which a limit range filter was applied in Gwyddion and the four SP-D molecules were not separated,  the N of 75 represents just those where signal processing found peaks out of 200 plots.

Getting closer to making a “concensus SP-D LUT plot” from which to build an AI model

Getting closer to making a “concensus SP-D LUT plot” from which to build an AI model.

I had four SP-D dodecamers to work with, literally hundreds of plots, 5 different plot peak finding algorithms (apps, programs, websites), and a dozen different image processing programs, all to find the perfect peak plot for SP-D hexamers.  These molecules are bilaterally symmetrical (three identical x three identical) with the N term junction in the center.  Little is known about the central connections though the CRD and neck regions have molecular models.  Taken about 3 years to try to figure this out, input would have been (would still be) very valuable.

I am hopeful that an easy technique will be the outcome, that is an easy technique for assessing peaks in many different types of molecules (images from AFM at this point), particularly those which are bilaterally symmetrical.

Out of 7.7 billion people

Out of 7.7 billion people, I marvel that I have not found ONE single one with whom I can share my interests: not in gardening, mosaic, stained glass, polymer clay art, science, electron microscopy, pattern making, music, writing music, repairing old houses, making walkways with concrete.  You would think at least ONE person would be around to do these things with.  Dunno…  what are the odds.

Verge of a Dream: Advice

I’ve heard it said
What seems like
Good instruction
be not attached
To things. So
maybe three
times or maybe
four.
Passed it on to
Titan yet there,
throughout
all my lifetime,
it was, and is,
in orbit,
next
To Saturn.
I’ve heard it said,
And sensible it may
Be.
to forge your
Own trail cause
Convention will not
Become
The mother of
Invention. Passed it
On to my captain
Who drew new plots
And graphs found
Board our
ship discovered
somewhere
Lost at sea.
I’ve heard it said
And it seemed
The path
Of progression
to do things better,
as a gift
to the next
Generation.
And now
mostly done with
Looking I wish
I’d followed
footsteps
That connected
Me and you
much
Less to now
and
more
moored my
life to then.

RLB 7-31-2022