Category Archives: Ultimate order, the cell
NC-AFM
Non contact atomic force microscopy (paper here)
Tired of figuring out faulty scientific illustrations ?
The LAMP family is characterized by a conserved domain of 150 to 200 amino acids with two disulfide bonds. While reading this I looked up one of the references to see what they had pointed out as the morphological differences between endosomal membranes and lysosomal membranes and found this diagram in the publication linked here. While is seems trivial in a sense, it is not really, since visual depiction of facts 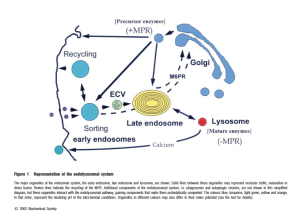 needs to be as accurate as verbal depiction of facts… otherwise it is “fake science news”. The diagram below goes against everything I have learned about cell biology…. with the arrow on the bottom pointing FROM the lysosome, TO the early endosome…. what? The early endosome is the beginning, by their own words statement the early endosome is created de novo at the cell membrane. So then I ask, why is the arrow not pointing in the other direction? and here is a quote “Endocytosed material tends to flow vectorially through the system, proceeding through the early endosome, the endosome carrier vesicle, the late endosome and the lysosome.” speaking to this subject.
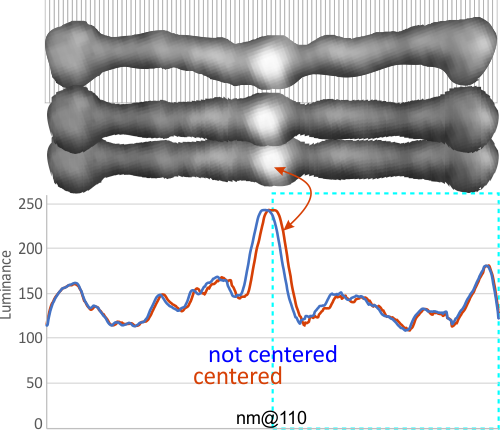
LUT tables for a single SP-D dodecamer centered horizontally and vertically
Luminance plots of SP-D dodecamers (from other researchers AFM images) vary widely, due probably to preparation, chance arrangement of the arms when plating, bouncing of the cantilever of the AFM microscope, quality of the digital image and at least a few hundred other factors.
I am however convinced that usable information can be gained by looking at these images closely. In the process, there are a bunch of steps that need to be taken (in my opinion) to make the outcome easier to interpret. I don’t think this adds bias because it is done to all images, not just the ones i “like” or think look like I would want them to look.
1, this is likely a bilaterally symmetrical molecule, with unequal arm angles.
2, there is seemingly some arm arc angle as well.
3, the dimensions given in micrographs vary widely and therefore an exact dimension is not really known, even if the bar markers has been placed accurately, there still would have been wide variation in the size therefore 100nm is used to control that variable.
4, there is variation in the way different AFM record these same images (bouncing and skipping, focus, resolution
5, there is no consensus on how much of the N terminus is responsible for the bilateral symmetry
6, there is no consensus on the shape of the collagen-like domain
7, there is no consensus on what comprises the coiled coil neck region in the AFM images
8, individual arms in any dodecamer can be longer or shorter (curved etc) than the other arms which changes the LUT tables therefore each arm is adjusted to a 50nm length beginning at the N terminus
9, the position of the 2, 3 or 4 and even sometimes 5 peaks along the collagen-like domain are not centered, but a depth of a valley which is equal to 10 (out of 256) luminance units is used to call a blip a “peak” or not, in an effort not to bias results.
Below is a sample of two LUT plots (look up talbe = luminance plots) where two trimers – as a bilateral set from four dodecamer arms have been cut into one single-adjusted-100nm length. The image was cut at 1nm segments and centered horizontally (second AFM image from top). This image has the N terminus bright spot slightly off center, and the bottom AFM image it was centered (each of the two trimers now equivalent to 50nm in width. Plots show centered and non centered luminance values for the two images and it can be seen that they do not vary otherwise. In ImageJ the plots were derived from a rectangle of approximately 500nm x 15 which was drawn in the center (full length) of the images.
Some images are much more skewed, and so centering makes a bigger difference, this one is pretty close to center anyway but the technique is offered up here.
Line or rectangle? best LUT plots using ImageJ
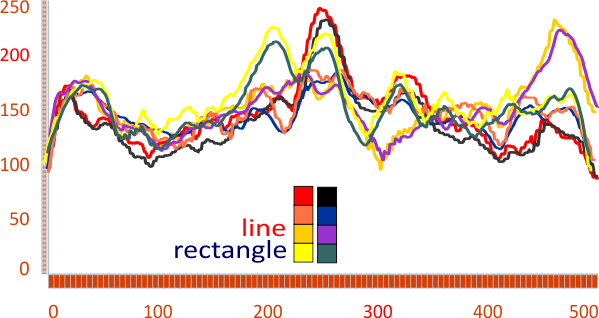 RE: Do lines or rectangles produce better LUT plots using ImageJ when the tiff file is an AFM of surfactant protein D?
I think maybe rectangle (something on the order of 500×15-25nm produces the smoothest plots (not the plots with the highest peaks though). Using a rectangle seems to eliminate some of the fake lines produced by cutting, centering and exporting to png (images which have been processed and manipulated to set dimensions but it also just lowers by a tiny bit the height of the luminance. — Below are pairs of plots taken from the same images — marked by color, and it is also obvious which plots are pairs by looking at the LUT plot lines as they are nearly identical whether using a single line or a rectangle to assess luminance. In summary, i think the LUT plots are best made using as wide a rectangle as possible cutting through the artificially straightened (see previous posts) and artificially centered plots.
TOO LATE:
I get kind of sick to my stomach when i read that someone has discovered something that I found (recognized) a decade or more earlier, and know full well that there were people thinking of what i was thinking of even decades before that.Here is a cute article (i call it cute) because it was a worn-out thought in the early 1980s, and I had published at least two papers on the very close connections between mitocondria and cellular elements (desmosomes in particular) and also with nuclear pore filaments in a host of cell types (but mainly hepatocytes)…. Power to this woman, but shame on the editor for not searching back into the 50s and 60s where the wonder of higher resolution electron microscopy was burgeoning to finding out what the real masters thought (and even “moi” was thinking about the connection between organels and possible meaning). This is not to say that the isolation of the proteins and factors was known then, no, but the concepts were there.
What is silly is that I also pseudocolor and isolate organelles to play games with graphically… ha ha. This site is full of examples. oh well.
Morphometry: SP-D dodecamers
I am hoping that some useful information will come from the development of this method of assessing AFM images, in particular here, of SP-D. The measures are actually 8 in number but i am not showing but debating whether it is necessary. All dodecamers have been normalized to 100 nm arm length. Just one image (not my AFM but found in the literature) is shown, a test of the methodology.
Below there are measures in square nm for the carbohydrate domains (shown in the top part of the image), values for the angle of separation of the arms (only one acute angle is shown here, mean of the acute and obtuse angles for this image are given below); peak width is given, and peak height (both in nm) (from the deepest part of the valley on one side), nm2 for each peak (also from the deepest point on the peak), luminance is given (0-256) from the look up tables (obtained in ImageJ). I understand that there are program s that can do some of these functions “automatically” but there are always details that machine vision really doesn’t “get right”. This is an N of one, but this particular molecule was chosen (subjectively) as something very typical of AFM images purposefully in order to develop a technique.
So many things could easily be done…. for starters, comparing the nm2 of various CRD on the literally hundreds of CTLD (or even just the more well known c-type lectins, not to speak of arm arc angles and the position of the branching, and the N terminal connection width (in terms of nm). All of the numbers below tell something about SP-D which need to be redone in dozens more images, and then compared to the variants of SP-D.

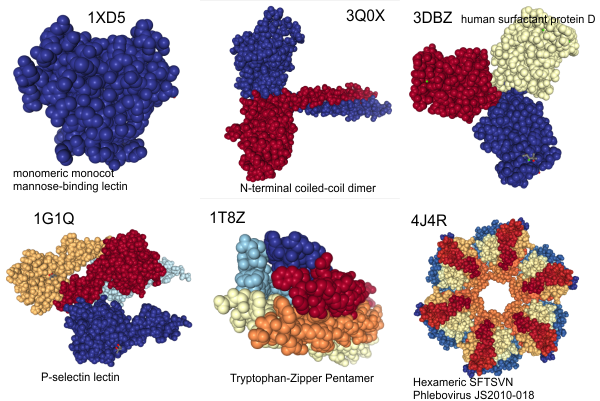
Nature loves copy and paste
Just looking at a few proteins on RCSB PDB lets us all know that for sure, unequivocally, without question, nature is great at copy – paste – mirror – rotate. It is apparently an easy way to achieve variation. 1, 2, 3, 4, 5 and 6 (i am sure there are jillions more, i just stopped at 6). Great for defining new functions and structure-function relationships while conserving effort allowing for flexibility in evolution
C-type lectins: numerical summary
C-type lectins are an amazing group of molecules (well all molecules are amazing, LOL), part of the CTLD (C-type lectin-like domain) superfamily of glycoseaminoglycan-binding proteins: touted to be present in all multicellular animals, plants, and fungi and unicellular microorganisms such as a protists, bacteria, and archaea. C-type lectins function in glycoseaminoglycan synthesis, in enzymes, enzyme inhibitors, in coagulation and thrombin, and as esterases, dismutases and topoisomerases and growth factors. They can be active inside or outside a cell; as cell adhesion molecules, as extracellular matrix proteins, as growth factors and morphogens, as lipid binding proteins, chemokines, lipases, annexins,
A-type lectins (someone will describe someday)
B-lectins (beta-prism lectins)
L-selectins (on lymphocytes —
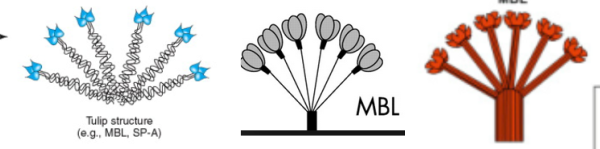
MBL is a kind of prototype for this family of proteins. (working on this)
Calcium dependence was the key property of the compact carbohydrate recognition domains (CDR). But not all C-type lectins bind carbohydrates. It is clear that the use of the term CRD and c-type lectin domain are often subject to such broad use that confusion arises (review here ).
Dimers
Trimers
First thing to clarify is whether the term “fold” which is used in many publications is really meant to be “the fold” or a more general description of a property, as in the “folding” plural. I cannot see how “the fold” would be applicable since there are many folds in any one CRD.
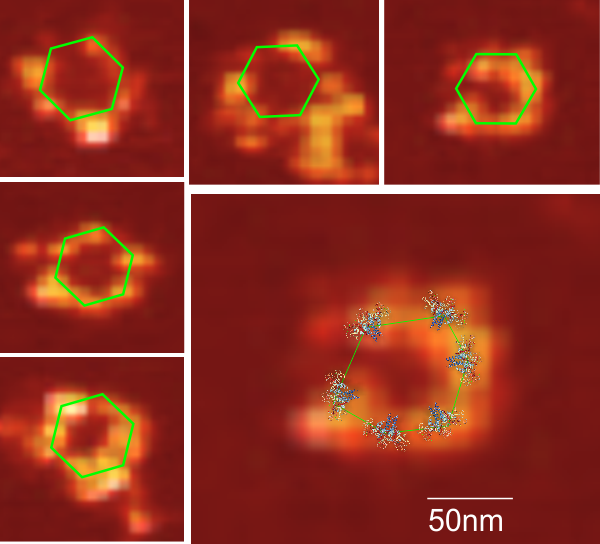
Nice atomic force microscopy of mannan binding lectin
Nice atomic force microscopy of mannan binding lectin by Dong et al, though I could not use my method of measuring LUT plots on them. Nevertheless, in some of their images there was clearly hexagonal distribution and I have rearanged, marked and reposted some portions of their AFM image here and superimposed the carbohydrate recognition domain, at a slight angle (as would be projecting up from an N terminal (not shown) binding of six trimers. Many many (almost all) other researchers diagrams of show MBL as an oligomer with 6 trimers, not just three. The selected AFM images are “top down” the angle being 30o, the angle of the three diagrams is from the side. I don’t know why the difference here. (top image by Dong et al, bottom image is from google images no authors listed in this post but they are readily found online).