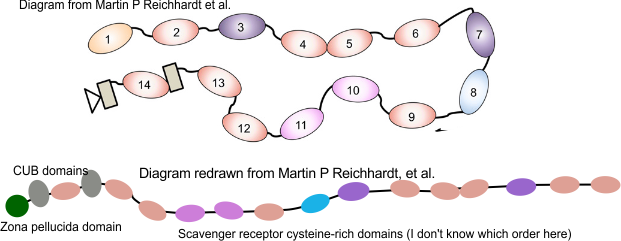
I think this image shows pretty nicely how little, except for cosmetics, the image processing of a cropped portion of a multimer involved in immune defense and differentiation in epithelia shows here affects the raw data (LUT grayscale plots). There are small variations in the length of the “arm” which are more likely due to that actual tracing in ImageJ than any difference due to processing. That said, gaussian blur tends to increase the dimensions slightly, highpass filtering increases the grayscale, and unsharp mask creates greater peak heights. So the peak number and the smoothness of the plot can be improved with processing, and the peak height, but no real gain in information is obtained.
The greater task is to look carefully at the molecule, deciding whether tracings of the beginning and ending of close, twisted and overlapping arms (as plotted) (made by hand) make sense.
Images below show plots (color coded as to image processing filters used) and the actual images and trace-lines (screen print from ImageJ tracing). In this case: filters, each named, were performed in photoshop; plots were made in excel as traced in ImageJ; calculator.net was used for determining means and SD of arm length and peak number; corelDRAW was used to normalize the x axis (y axis remained unchanged from original plots) and to color code the plot lines.


Next task is to measure peak widths and heights. Unsharp mask (amount 300, 40px radius, 20 threshold) followed by a 10px gaussian blur provided the smoothest plot. The High peak (left) and low peak height for the next three peaks, and a subsequent high peak seems to be a pretty prevalent pattern for arms in this molecule.
This is the plot for unsharp mask and gaussian blur. It is so remarkably like the very first plots I made on this protein. Since 99.34 nm was close to 100 i used a 100 set of 1 nm dividers to mark out the valleys of these peaks. Interesting features are the absolute regularity of the first five peaks, not in height, but in width, and the first and 4th peaks being higher, and the series of similar size peaks in the middle of the plot.


