Category Archives: Ultimate order, the cell

The beauty and order of life is astounding.

More on RGB to grayscale conversion of AFM images of SP-D

Another post giving the math for converting RGB to greyscale is found here.
It seems that Luminosity, Lightness and Averaging are three methods which are used often. I am looking for someone who can find which of these three methods Photoshop 6 and CorelDRAW x5 uses to convert RGB to greyscale. (CorelDRAW under “autoadjust” and

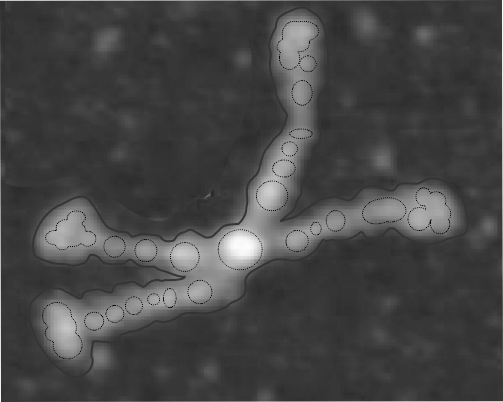
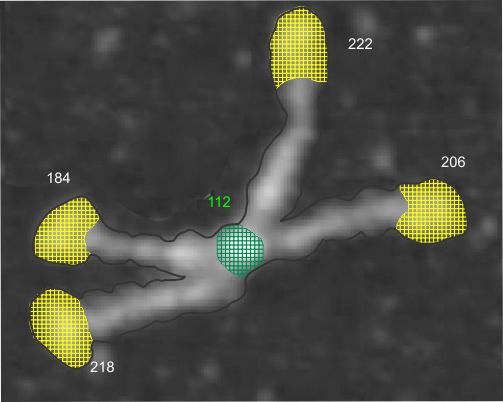
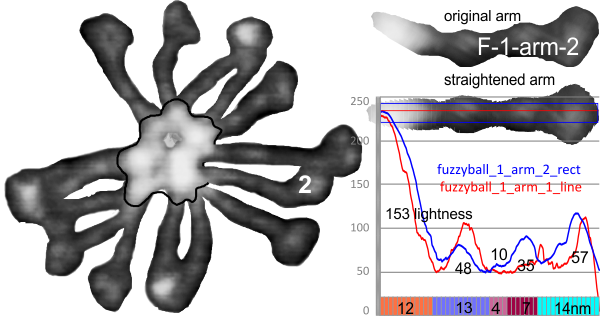
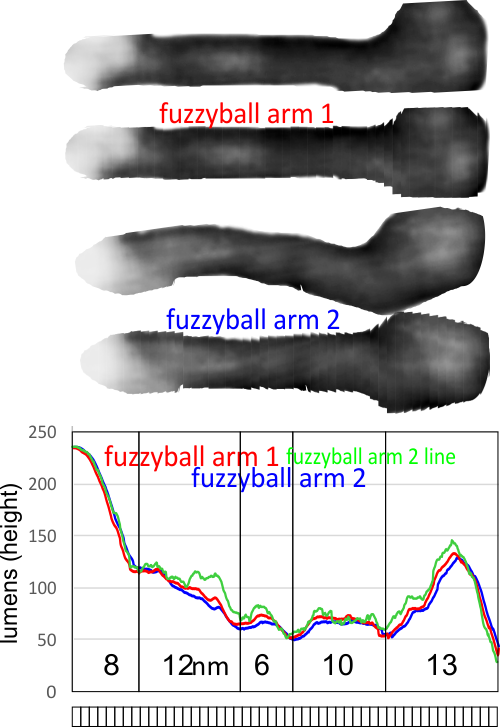
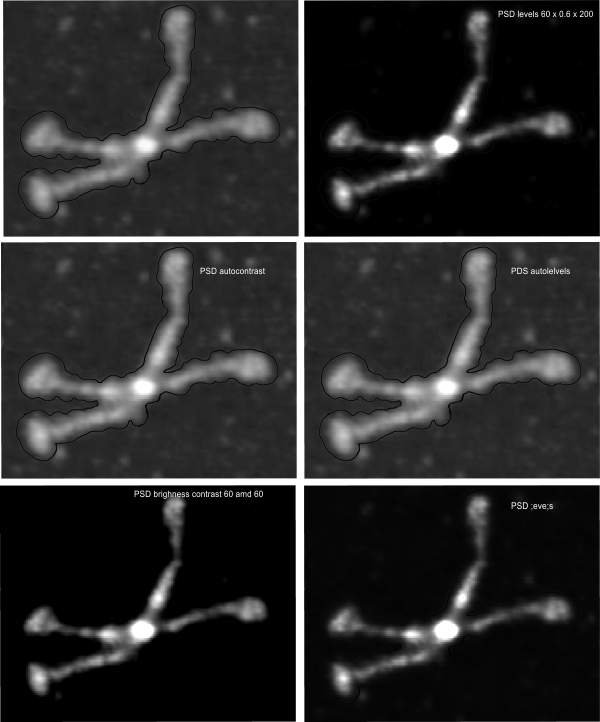
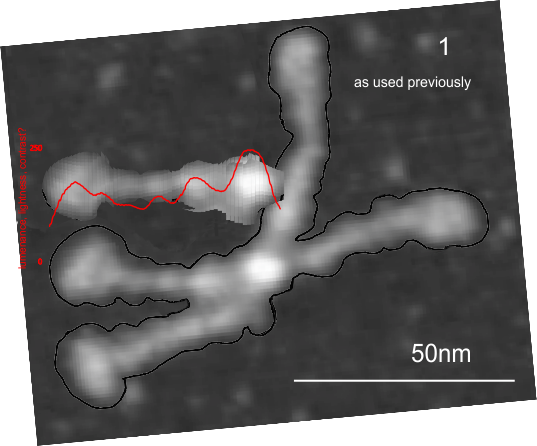
In photoshop 6, thresholding a black and white image just doesn’t really help (in my opinion) because there is too much loss of the greys.Below is an image (used many times before) of SP-D (not my AFM images, someone elses available online) which I have manipulated in photoshop using image/adjust/levels, and image/adjust/autolevels, and image/adjust/autocontrast, and image/adjust/contrast in various ways. I will plot my favorite arm (upper left) which has three peaks between the N terminus center high point and the CRD, having probably appeared more times than any other configuration, and the pic is also biased to my assumption from previous LUT plots, to have three different heights for those three peaks, and also different widths. I will post plots in for that same arm, in the same order below. Top left, image as used previously (test 1) provides a great plot.

Test 1, image as used previously, not very much adjusted (i cant remember but likely some contrast increased and brightness reduced after the original conversion from color) but done in the same manner as other SP-D dodecamers that have LUT plots (see countless previous posts).
Confirming, and reconfirming previous LUT plots, there is an N terminus peak, three intermediate peaks (in this case the third peak from the N terminus is pretty small) and the bumpy peak of CRD (owing to its distribution of the three CRD domains in a large bulb like end.
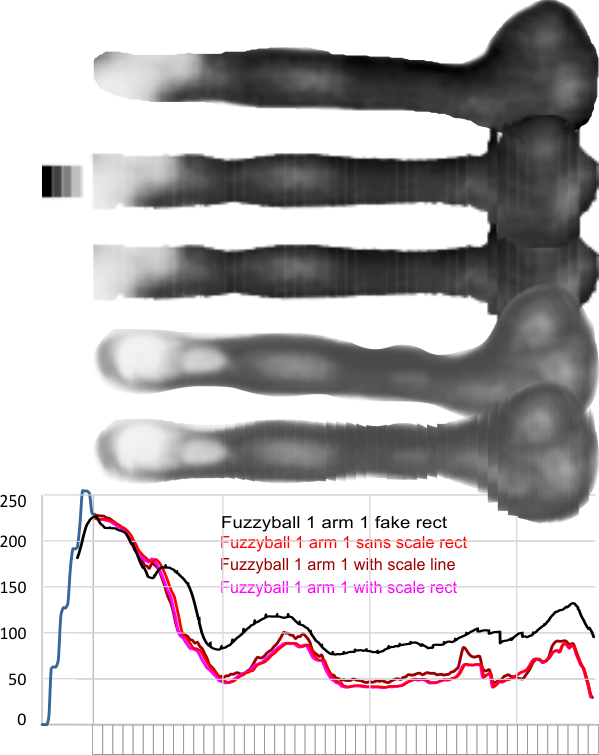
Little adjustments, same peak, so that points to the small effect that the several different algorithms for changing RGB to greyscale may not matter as much as I thought. Here is a link to another article on converting color to greyscale. and yet another on terminology and greyscale (ok, so i need to remember to use grayscale not greyscale) conversion.
While i know to little about this to have an opinion, my basic understanding is that most of the conversion software attempts to mimic what the human ee sees, rather than wht the RGB actually convert to.. in terms of — Gray = (Red + Green + Blue) / 3 — which for science, i.e. looking over micrographs) probably needs to be as free of attempts to increase or decrease the “RGB” values to fit human perception. SO, that said. perhaps less manipulations, fewer algorithms might be the best approach.
I have used RGB conversion in photoshop, in coreldraw, and desaturation to convert RGB to grayscale (yep now gray with an “a”).

After reading (rather stumbling through) some manuscripts and blogs about dozens of RGB to grayscale equations … my decision is to go back to basic grayscale = R+G+B/3 rather than use all the fancy formulas that make the grayscale look more pleasing to the human eye and automatically adjusting the blue and greens to make things look “nice”. Then I can adjust the contrast to what pleases my eye, emphasizes what I am looking for, and brings out the structural detail in my images, manually, and define it as such. To find the codes that were used in some programs is totally impossible, and if found are probably just as biased a conversion effected by my “hand made manipulation” of the images. If the conversion from RGB to grayscale is standard and the adjustments, tweeks are mine I can just comment on them in a line of text in the materials and methods… ha ha

Who knew that was (could be) so complicated. Hahaha…

FOR ME…. my eye is still the best tool to convert and desaturate and change the brightness and contrast.  It might very well be biased, but at least it is not brainless.

Here is the SP-D dodecamer I see


It is easy to see that there is a definite width variation in at least three different places. Center N terminus peak is not the widest, though it is the tallest “Lightness” or “luminance” peak. The CRD (four outside areas are the largest in terms of width, but not the tallest but next tallest and it is the greatest in square nm (in this image, each being about 200 nm2 while the N terminus is about 100 nm2).  I guess at some point someone needs to do area under the curves for both width and height and get a total nm for each of the regions.  It seems that there are three peaks and also a little blip for the area just before the CRD (presumably the coiled coil neck region, that means four peaks between the N terminus and CRD.  And sometimes it looks like 5.

Nm grid overlying area of the N terminus and CRD shown below.  The nm of the largest peak between (and next to N terminus) and CRD is something about half the size of the N terminus nm2.

ALL GENDER RESTROOM

What the h**L is an “all gender” restroom. As far as i remember there are only two genders, anything else is fabricated. The two genders include all genders encoded by our DNA  – regardless of how fragile it is, how much it jumps, or how it gets diced, deleted, CRISPR’d, rearranged, inserted, STOP’d, excised, SNP’s or modified — biologically  its still just XO XX, XY, XYY, XXY, (I dont think YO is viable) and that is likely to stay the same regardless of how you move it, remove it, or put it to work. So whats this sign about??

I prefer this one which still takes into account that we are X and Y assortments, and that some need help (infants and those who are disabled in some way) but without making jokes or being condescending.

Porcine SP-D dodecamer

I found this article by Martin van Eijk et al which had rotary shadowed images of surfactant protein D.  One of these (which might be a dodecamer…with perhaps one of the trimers (on the left of the image) that is a little unwound? perhaps, or it also may be a structure with more than the four trimers of a dodecamer) but it has a small center area which presumably might indicate a different type of N terminus binding than human SP-D.  I would like to find AFM images of porcine SP-D to compare since this image (shadowed) and AFM produce such different views of SP-D that they are not comparable.

It will be fun to count the arms on the fuzzyballs in this image.  It appears that the porcine SP-D dodecamer (which i have measured as the diameter of a circle (dotted red line) that intersects the CRD) is just over 100nm, actually about 110nm according to their bar marker (red below). The ratio of CRD to length and width of the arms of the collagen-like and N terminus domains “looks” at first glance to be similar to hSP-D.

Center low brightness (lightness) area in SP-D fuzzyballs (between the Ntermini ?)

The dark area here in a fuzzy ball (not my AFM image, someone elses) shows a consistent 6-8 nm dark center…. between the N terminus peaks.  Both arms (as best as I was able to stretch them from the CRD across the fuzzyball (which may not be at all accurate, and i think is NOT accurate but used for now) the center is vacant.  or at least it has a valley in the LUT tables that is nearly as low as the valley before peak 1, 2, and 3 begin on the left and right halves of the molecule.  I think it is more likely that two trimers bend into a U shape and are connected somehow side to side.  I will continue to measure the arms as separate entities.

On the surface this might seem like a thankless task but i could be a valuable lesson in how collectins link together to make multimers.  Side to side links at the N termini in SP-A and MBP and other c-type lectins makes it very likely, more likely in fact because of images like that below, than any other arrangement.

SP-D fuzzyball 1 monomer arm 2

Measuring here the second arm of a 14-arm SP-D fuzzyball to determine whether the pattern of LUT plots made from each arm match up the plots for the dodecamers. There is clear pattern to the latter, and seems from two LUT plot sets to be true for the fuzzyball. The problem arises from the discrepancy between the dodecamers and the central area of the fuzzyball which seems to be more like a ring than a huge accumulation of N termini.

Little changes in LUT plots with manipulation of original SP-D images

Well, it seems pretty clear that the LUT plots gathered in ImageJ really are not affected much by the manipulation and scrambling around to make them readable in a program that doesn’t have a lot of line drawing flexibility.  I am convinced that the smallest amount of care will produce quite repeatable results in the LUT plots.  These images are photoshopped, cut, centered, rotated, saved and resaved as RGB or BW images, and the plots don’t really get too different, one to the other. This is good news i guess, hopefully it will be useful to someone studying SP-D
ON THIS HALF arm of a multimeric molecule (n=14) it still looks like the N terminus (left and a portion of the N terminus ring in fuzzyballs) will be the tallest peak (whitest – brightest – most luminous – lightest —still looking for that word to describe the digital whiteness) at or around 240 on the scale of 1-256. After that a close by and very consistent tall but not too wide peak, then possibly 2 or 3 small peaks and finally the carbohydrate recognition domain (not as high a peak as found for this domain – (whitest – brightest – most luminous – lightest level for the multi-lobed CRD).  Bottom two images of SP-D are photoshop images and NOT REAL., Modeled however after the top three images are of one arm which came from a single fuzzyball. (fuzzyball 1 arm 1)


Center ring in SP-D fuzzyball multimers

Revisiting an interesting idea (at least it interests me) is why there is a center in the surfactant protein D fuzzyball that has such an large “central gap”. After having plotted the luminance peaks (height) on a half dozen SP-D dodecamers I decided to approach the arms of a fuzzyball in a backwards manner, that is to measure it from the carbohydrate domain inward towards the N terminal domain and see whether the length and peaks along those arms were at all similar. The first fuzzyball that I measured (that is the first two arms of the first fuzzyball) had similar peaks, N terminal being the highest point at about 240 lumens (1-256 grey scale that measures the height of AFM images) and each peak (normalized to half a dodecamer (that is 50 microns) has similar numbers of nm accounted for in each of the typically 5 — not always — peaks from N terminus to CRD.

Top image — original from someone’s publication, two converted to greyscale and trimmed and one lightened in contrast to show the peaks, and bottom right, colored according the brightness, pink is the highest points measured, corresponding to the N terminus peaks and as seen in LUT plots of SP-D dodecamers.
While I have not gone back to the original publications to measure the size of fuzzyballs (averaging CRD to CRD measurements as diameters, with the published micron markers I do know that the micron markers are poor indicators of what the actual magnification is… just sloppy measurements or perhaps real differences in size, but these are not my images so i don’t know. But I am assuming that the fuzzyball arms are not different in terms of AA sequence, and because they plot the same shape in luminance as do dodecamers, I am assuming that fuzzyball SP-D arms are a similar length (that would be @50 microns from N terminus to CRD)

Image below shows the fuzzyball analyzed, with 14 (though i acknowledge that one arm might actually be overlying a 15th arm… hard to tell) with a mean length (calculated according to the LUT tables and plot curves as mentioned from the CRD to the N terminus peak) a distance of about 22nm. This distance is actually as prominent (and long) as any measured peak in a single arm. In the image below you also see curved arms (which i did not use arc angle length calculations to straighten but just ysed linear distance which underestimates length. (i could do that but didn’t make the time to do so and even with curves underestimating length the mean was 44nm +/- 4nm and the remaining nm would not account for the center empty space in the fuzzyball which was anyway.  Average diameter of the central dark area (covered here by the sqnm grid) is 22nm+/-2nm. The square nm of the empty space is about 300. grid beneath arm measures = 50nm width.
LUT plots for two arms (both on the right hand side of the first image) cut into 1nm slices, centered and plotted by either a rectangle or line in ImageJ are shown at bottom.

The bottom line of this post is that the N termini of SP-D are probably joined NOT end to end in a fuzzyball like they are in the dodecamers, but side to side. Why would they be different?

Lysosomes: a few interesting facts

1. Lysosomes are known to contain more than 60 different enzymes
2. Have more than 50 membrane proteins: Hydrolytic enzymes, including proteases, nucleases, glycosidases, lipases, phospholipases, phosphatases, and sulfatases
3. Produced by RER via golgi then small vesicles
4. A mannose 6-phosphate is a sorting signal specifically tagging proteins for lysosomes
5. Lysosomes are very heterogeneous (amen….considering those in liver cells containing perflurochemical emulsion particles)

Defined self-assembling structures

Here is an interesting publication which I attempted to use to demonstrate an easy morphometric method for defining AFM images.
This is apparently an amaloid protein which the authors called apo-SBB fiber and I personally know nothing about this protein but have made some measurements that show that interesting things can be derived from using simple morphometric tools to evaluate microscopic images.

It appears that the peak heights (luminance) might be about 12-15nm in “diameter” obviously not round here. In the images measured below there is not number for the bar micron marker provided, but it has been estimated from the “diameter” measure above to approximate a reasonable number — which looks to be 50nm.

The peaks do not appear to me to be related to the bends (the 129o angles). Some peaks are adjacent to bends, some prior to bends, and others right at the bend, thus in these few images provided there may not be a predictable pattern to the peaks except that about half of the peaks appear as two nearby peaks, the other half are singlets .

Measuring arc angles from 13 angles on the above and below images stayed similar to what was obtained for the single colored micrograph above, it change only slightly to arc angle=128.3 decrees  +/- 10

It also seems like there is a periodicity in the protein length as well.This portion of a fiber is taken from the most faint of their tracings which to me showed amazing twisting. The periodicity (shown above at about 12nm and here X of 17nm probably somewhere between, and the peak shown above two different measures, and here at about 22nm which is close to above (despite their lack of marking their bars with actual micron  numbers). So the different mags, and measures look similar for their pictures. I did NOT need to straighten this particular portion, so that also confirms that using the slice and center technique does pretty well ad straightening out images of proteins that are curved.