Category Archives: Science and art cover illustrations

Mathematics Visual – Matematicas Visuales — Geometric bodies

I was looking for help calculating the total height of a stained glass pattern that I was attempting to create for a diamond shaped pyramidal structure. I found it took me about 2 hours on google to even find the correct name for the structures in three dimensions.  This says nothing about google’s algorithms but it does say a lot about how little I remember about geometry (65 years past, maybe longer).

After looking over many sites I was totally overwhelmed with this one in particular and it is on a par with none other I have visited.  Check out the animation, the presentation, the whole site is really awesome.  However, I still have to ask for help — which I will do — for calculating the height of my pattern (and very likely, I wont find a single customer who would be able to enlarge it and calculate the height for themselves either… just to alleviate my own reduced self-worth at not being able to remember how to do it from 8th grade.

HERE is their webpage for an octagonal pyramid and for truncated pyramids. Bu
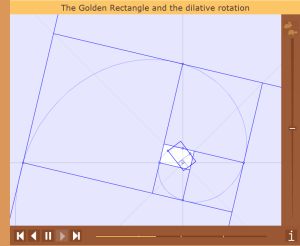
t looking further you will find many awesome pages, this one on the golden spiral.  Just peruse the site, you will be amazed. Here is a screen print from an animation.


Identifying and diagramming mitochondrial proteins

This group did, in my opinion, a reasonably good job of modeling mitochondrial membrane proteins in a way that utilizes all the information (likely) available.  I would like to be able to do such for all known mitochondrial membrane proteins, or even the whole mitochondrion… matrix proteins as well, but lack the skill and knowledge (working on the latter) to do so at this time.  I would have made only one adjustment, and that would be to have depicted the inner and outer mitochondrial membranes as actual molecular structures as well. It is still possible to detect the areas the transmembrane areas in some of the molecules.  It is a little confusing to have the outer mitochodrial membrane as a stiff line, as we know it curves with, sometimes closely to (as at the pores) and other times further apart, and the difference in the curvature of the inner mitochondrial membrane is sort of cumbersome and doesn’t flow through the transmembrane domains comfortably.  But a great depiction, none-the-less.

Here is their citation: Medlock, Amy & T Shiferaw, Mesafint & Marcero, Jason & Vashisht, Ajay & Wohlschlegel, James & Phillips, John & Dailey, Harry. (2015). Identification of the Mitochondrial Heme Metabolism Complex. PloS one. 10. e0135896. 10.1371/journal.pone.0135896.

Isolated mitochondrion with smooth ER

A single isolated mitochondrion (blue)  and attached SER (pink) from a mouse at D28, likely isolated from liver,  postnatally having received NAC. This and other images were of controls for D28 mitochondrial pellets from hepatocyte specific GCLC ko mice also receiving NAC.  There is a lot of substructure going on at the attachment between the outer mitochondrial membrane and the SER membrane, and some tiny cristae right at that junctional tether. It is possible that a mitochondrial ribosome is in the field as well (dark dot rounded object in mitochodnrial matrix – middle right. (also there is a tiny piece of dirt, so dont be confused). So the periodicity between SER and mitochondrion seems to come out at about 35nm which is larger than I had hoped, but there is always the possibility that the structures were cut tangentially.

G protein, GPCR, GDP and GTP diagram from wikipedia

Wikipedia post (thank you wikipedia) with this diagram about G protein, G-protein coupled receptor GDP and GTP I thought was pretty good. “Activation cycle of G-proteins (purple) by a G-protein-coupled receptor (GPCR, light blue) receiving a ligand (red). Ligand binding to GPCRs induces a conformation change that facilitates the exchange of GDP for GTP on the a subunit of the heterotrimeric complex. Both GTP-bound Ga in the active form and the released Gßgamma dimer can then go on to stimulate a number of downstream effectors. When the GTP on Ga is hydrolyzed to GDP the original receptor is restored.”

What kind of diagram is this? mitochondrial cristae

I find that diagrams and illustrations for science are so often NOT GOOD, NOT EXPLANATORY, and are TOTALLY CONFUSING.  Here is an example. It is from a very nice article, (Biochimica et Biophysica Acta 1793 (2009) 5–19), but the diagrams of the arrangement of cristae just doesn’t make visual sense.  It is an injustice to readers to create confusing images and put them up as learning aids.  THis diagram misuses the shading when it creates a look of 3dimsnsions…. it makes no visual sense in any of the three drawings in this figure.  To create shading on one portion of a diagram (e.g. the middle figure) which in this case was the intercristae space, which is called the intermembrane space, and NOT make the shading equivalent on the mitochondrial matrix is just careless, and misleading. The lower diagram is beyond deciphering…. it looks like there are three orange fingers poking up, from a space with holes.  Nothing resembling anything that is shown with real TEM images.  So sad.  It wastes time and  sends wrong information.

Easter bunny mitochondria

Please forgive, LOL, as this little mitochondrion which is from guinea pig liver, just was staring out from the page. You might notice that there are some (blue) regular protein molecules near the bottom right and left.  These are likely to be ATPsynthase all aligned in perfect order — see previous post with similar structures from guinea pig hepatocyte mitochondria.