Category Archives: Science and art cover illustrations

Who could guess that desmosomes know hebrew?

Was looking at this model for the cadherins of a desmosome and I just happened to see “shin” there in reds and oranges. I love it when nature intersects civilization in an unexpected manner…. so fun, ha ha.  Just out of deference to the authors of this paper on desmosomes, 3D and electron microscopy I will list their reference in case you want to actually see the original. Al-Amoudi, et al., Nature05994 (2007)

RNP along the inner nuclear membrane

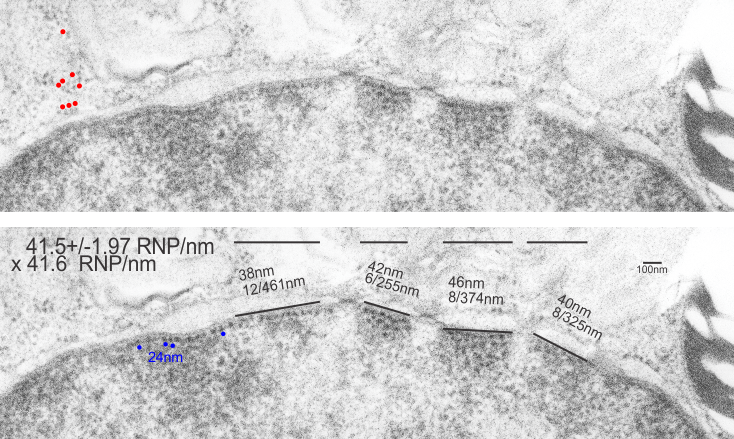
When i encounter electron micrographs where there is such obvious order i just marvel at the detail and complexity of life. Here on the inner nuclear membrane of an alveolar type II cell, in between the nuclear pores, there are little RNP particles, neatly and tidily spaced at about 41 per 100nm, and at about 24nm diameter (slightly smaller than the ribosomes from this same micrograph used at a measure of 27nm diameter. These are organizationally (that is, the RNP and inner nuclear membrane, and the ribosomes on the RER membrane) and with such similar but not identical sizes, shapes and arrangements,  that it becomes almost silly not to see an evolutionary structural relationship.

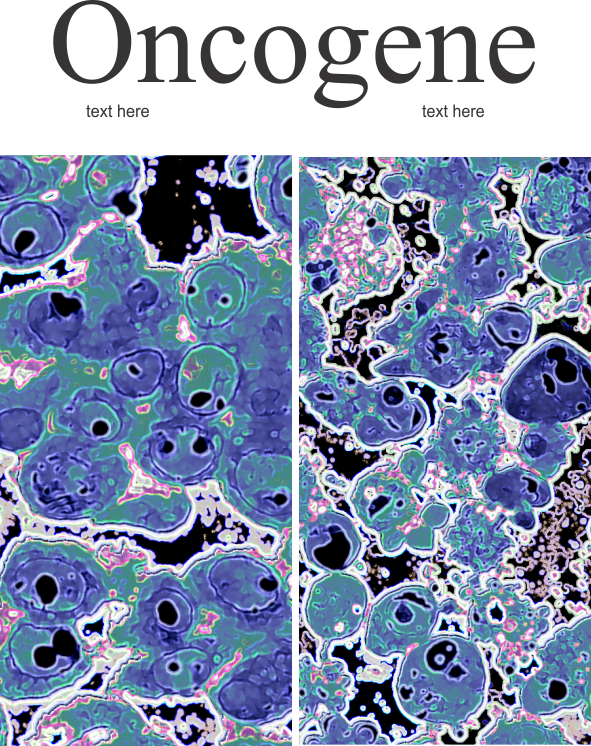
Picture on top has NOT been altered, but the identical picture on the bottom has had the distinct areas of RNP burned using photoshop just to show you what i see. Red circles are ribosome size, relative to the enlargement of the images (taken at 27nm) and blue circles are RNP granules, which are apparently closer to 24nm diameter. Point here is the rigidity of the inner nuclear membrane, and flexing of the outer nuclear membrane at sites where the ribosomes on the outer nuclear membrane are actively producing protein.

Four adjscent inter-nuclear pore distances have been measured and RNP counted. Mean+/-SEM is given at 40.5 ribosomes/100nm  and all ribosomes together with all nm is 40.6. A tangential area of the inner nuclear membrane and many RNP forming a grid like network is seen about midway-top of both micrographs, but accentuated in the lower micrograph.


How funny is this?

Modeling surfactant protein A has been a fun journey. Me, wellllll, this I had never done before last week.  But I leaned by error that there is a FASTA statement that needs to be used in some programs.  I guess I must not have typed this in correctly when I used the program at UMich either written by or run by Yang Zhang. FIND IT HERE: Yang Zhang. I-TASSER: Fully automated protein structure prediction in CASP8. Proteins, 77 (Suppl 9): 100-113, 2009.  BUT in this case it incorporated my statement into the AA sequence, ha ha. and here you have what  SURFACTANTPROTEINAGUINEAPIG looks like as a protein.  The structure itself is wonderful, but the blue part at the bottom is the “monster end” read as an addendum “SURFACTANTPROTEINAGUINEAPIG” protein… ha ha… too cute, made me laugh.  So just snip off the blue, and you have the real modeling of guinea pig surfactant protein A.

Inner ear stereo-pair

Many years ago I was interested in reconstructing 3D images from sections of inner ear. I still have many of those slides and images. At that time my son Daniel Miller was into computer graphics. He took my highlighted 2D sections (as shown in the bottom image) and created this stereo pair.  Cochelar duct yellow, ampulla of the semicircular canals white.
It looks like we submitted a cover illustration as well. I cant even remember if it was successful.

Olfactory epithelial cell culture, a kind of mini-organoid in vitro

Olfactory epithelial cell culture, a kind of mini-organoid in vitro. This diagram was an outgrowth of doing some research on cultured olfactory epthelium with a woman in the department of anatomy. I was working on in vivo olfactory epithelium at the time, a rat model for inhalation toxicity and there was some collaboration among those interested in the sense of smell.  I did also a ton of electron microscopy on olfactory epithelial cell – organoids in culture and so I am quite confident that this old vector illustration represents a good “overview” of the cell types present (probably not in all) of the little lumps that were fixed for ultrastructural observation. IN fact I have a composite transmission electron micrographic montage of several of these structures which i should photograph (or rescan and reassemble) and post along with this.  I am pretty sure that this illustration was destined for a poster presentation. Legend for the cell types with the symbolic nuclei and colors to id which types of cells are present in this organoid. Sections were taken perpendicularly to the substrate, organoids were spherical, above the bottom layer of astrocyte type cells.

diagram of cultured olfactory epithelial organoids

Environmental health and Center for Environmental Genetics: old logos

Out of the past (at least 25 years) logos designed for the department and one of its major grants.  THings change, life changes, old is replaced with different — not necessarily better things.  Here is a memory from the past. I have the vector files in CorelDRAW and the basics are free to anyone who asks.

And the first WWW buttons for the CEG were very restrained (LOL)