In this case the liquid which the mouse breathed for 3 hours and allowed to recover for 17 days was E2. Thank goodness for good record keeping otherwise I would have forgotten what E2 stood for. Here is what the notations say (from back when Leland Clark Jr. was keeping tabs on all documents and publications. E2 (made by Du Pont) O2 solubility ml/100ml at 25oC 55.7, vapor pressure 56mmHg at 37.5oC, viscosity 0.6 at 25oC, boiling point at 104.4oC, density gm/ml 1.656 at 25oC, surface tension 12.9 dynes/cm at 25oC.
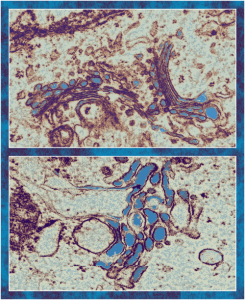
There were a bunch of MVB/LE/PFC organelles in these macrophages that I began to look more closely at the parallel leaflet patterns that were showing up at higher magnification.
Altogether there were 29 mice that breathed E2, it much have been a satisfactory fluid or there would not be a dozen or more mice that survived from 5 days to 449 days after 3 hr of breathing E2.
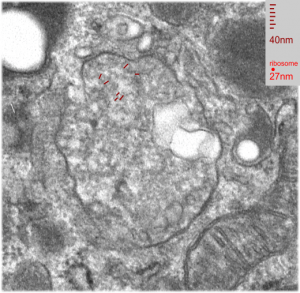
The electron micrograph below was one such body, I don’t think it could clearly be labeled a multivesicular body or a late endosome, but there are E2 droplets involved in its organization. I don’t believe there is any outer nuclear membrane association, but there are membranes with different distances apart which are clearly organized (actually a parallel disorganization – if such a thing can (and it does visually here) exist). So I sensed that the distance between the leaflets of these membranes was different within the MVB/LE/PFC thingie and in the membranes arranged just outside the MVB/LE/PFC structure and they were different. The latter look to be about separated at 22nm n=28, x=0.053+0.0014 (mm, on the micrograph translated to close to 22nm in actuality) , and I also measured couple of dozen distances between parallel pairs within the MVB/LE/PFC structure itself and it was closer to 28nm (n=31). When the long string of measurements were subjected to a t-test (remember this is an N of ONE macrophage (there will be others) so it is not really saying much) there was an highly significant (p=0.0001) difference between the mean and SEM of the two (color coded) groups. Pictures below show how the lines and data shaped up. White dotted line outlines the two areas sampled for leaflet separation.
Figure below that shows actual sites of measurement and place of measurement for each group.

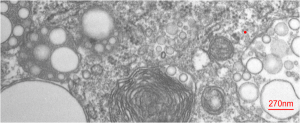
 In another macrophage –another micrograph — another block same E2 treatment and duration, a similar type of inclusion is seen, but this one did not display the linear qualities of the MVB/LE/PFC as above. There are two droplets of presumptive E2 in this image, they are middle right and upper left. Whether the lucent area in this inclusion is E2 is anybody’s guess.


