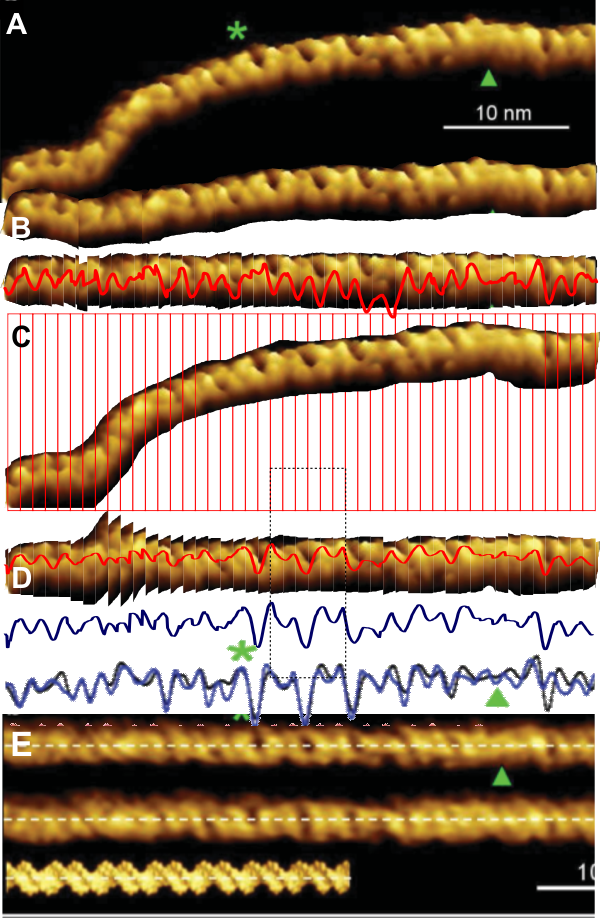
I searched AFM images and found this article bu Alice Pyne et al, which purports to observing differences from classic DNA helix in their images. They did this using some refined AFM techniques which I didnt read carefully, but did see plots for LUT for some images. I was particularly interested in verifying the ease and efficacy of the simple cut and center method for looking at variations in brightness of TEM images of molecules and thought I would test out my method on their images.
Firstly I was a little disappointed in the materials and methods….which stated so briefly “molecule digitally straightened” that to me was a red flag especially since the “digitally straightened” molecule was also considerably changed from the original and this opens up the method to the creative interpretation of the “one who digitally modified the image”. The latter is not in and of itself bad, it just needs to be spelled out in the methods section.
Had I not spent years fussing with images I might have just passed this off, but because i want a quick, unbiased, reliable way to quantify and semiquantify densities along the length of a molecule(s) many of them in fact to determine whether peaks and valleys are a matter of preparation bias and technique.
Bottom line here is that my transparent and pedestrian approach to measuring nm distances between bright spots and dark spots works just as well as their method…. and it is totally transparent and can be reported in the materials and methods.
In the image above, their plot (superimposed over their digitally modified image (the technique of which could have entered bias) next to the simplest, not even straightened molecule which i sliced into 1nm slices and centered (taking all of about 3 minutes) exporting the image to tiff and analyzing using a rectangle in ImageJ) produced very similar results. My own blue line plot (copy of the red line plot in the molecule that cut and centered) is so close to their two superimposed plots as to be startling. This certainly confirms my use of the cut and center approach to straightening molecules for LUT determinations. The most serious fall back i can see is the final length of what is assessed and bringing that into the correct relative proportions can be achieved by taking the arc angle dimension for length and stretching the image thusly.