When i saw this article by Zhou, et al, in EMBO 2011 I was curious about the shape of this really fascinating molecule, von Willebrand factor.
My first thought was to cut them up, straighten them (though many of the tightly bound short (non extended) though the molecules do look pretty straight and rigid (per their article) I did it anyway seeing if i could bring the four bright spots at the N terminal part of the molecule (i dont know that much about this protein, and the paper gives lots of details that I did not search out so i have to assume they are right) into a horizontal alighment to make a zig-zag LUT table for luminance. After looking at their images for a while I noticed that there was a huge discrepancy in the way the molecules were plotting out and their diagram. These are my observations.
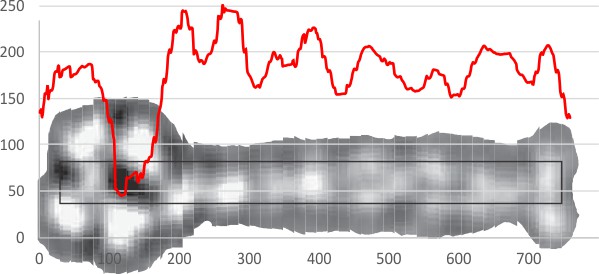
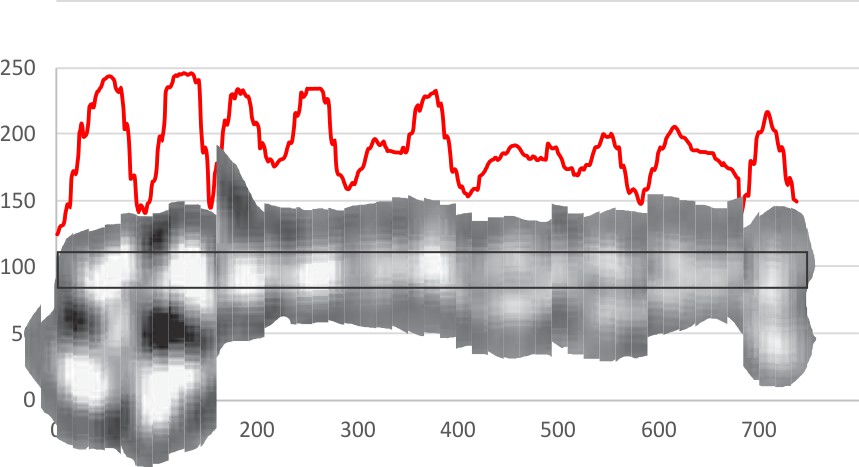
- I count 17 and maybe 18 bright spots along the molecule (see figure below), they only count 12 (for reasons unknown)
- I find two places where there are definitely two peaks (two bright spots, they only find one) (for reasons unknown)
- With LUT plots superimposed over the areas they measured I don’t see any reason to ignore the areas where two distinct peaks are present.
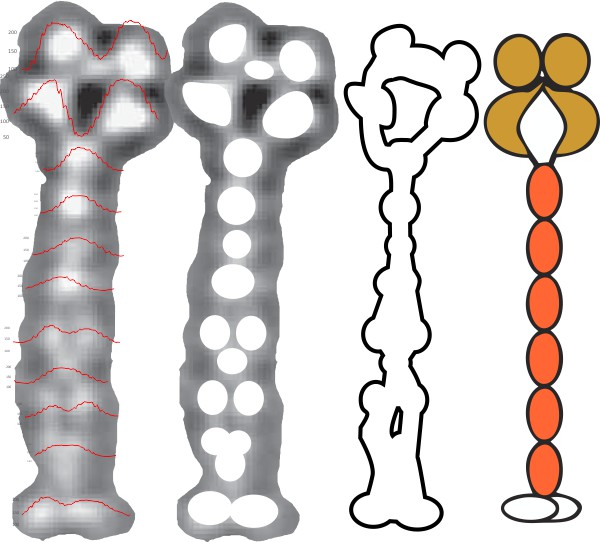
These are really nice images in their article, but i think more could be found in them. My horizontal LUT plots are top and middle images and the vertical LUT plots are on the bottom figure, plus what i think are the bright spots (correlated with the plots to the left) and a construct just from those bright spots at the center right, and their diagram on the far right. You can decide.