Monthly Archives: January 2019

LUT tables for peak heights, nanometer measures of distances between peaks for SP-D dodecamers

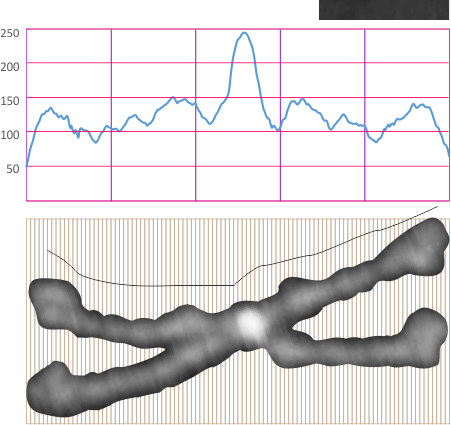
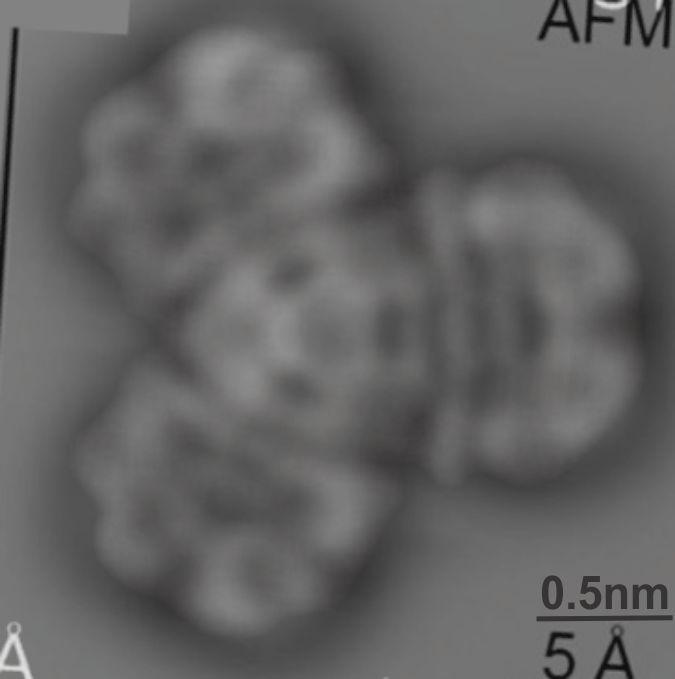
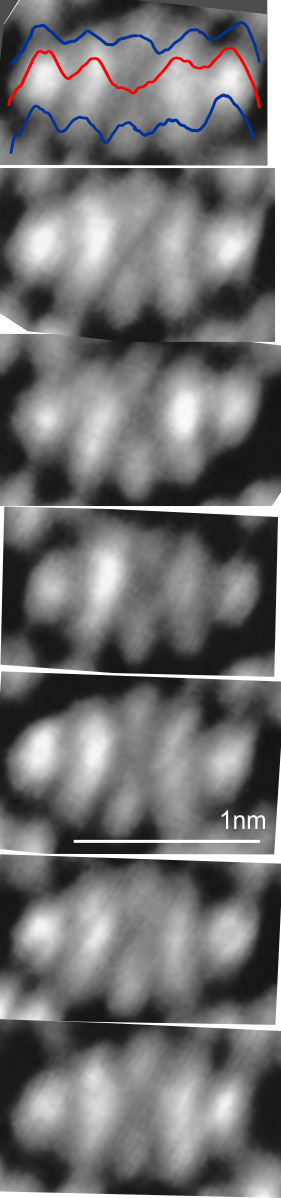
Measurements on surfactant protein D dodecamer images to establish whether there are three or two luminance-peaks between the center and the carbohydrate recognition domains.
Constraints:
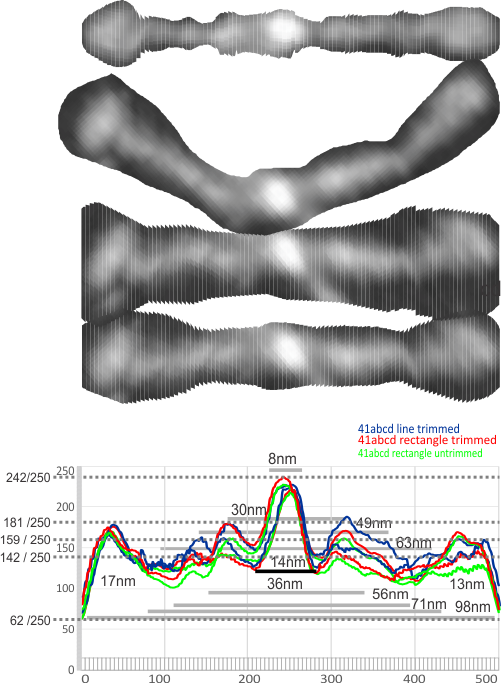
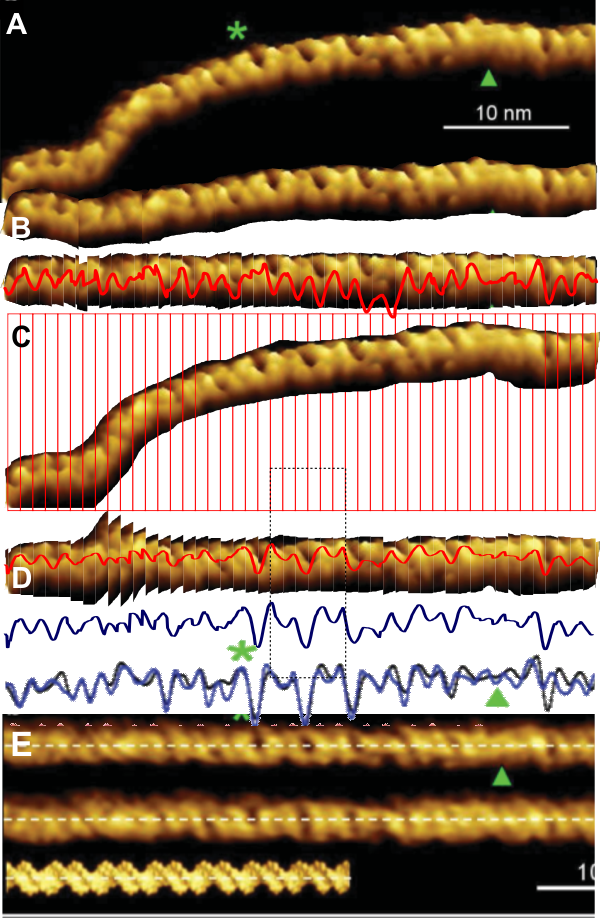
1: No absolute measurements exist for the extended straight arms of SP-D dodecamers since the molecules fall in different planes, arrays, configurations, and bends, in preparation for microscopy. The assumption is (though the images published in scientific articles are no where near in complete agreement about what micron bars measure in those images) but consensus suggests that the near periperhal area of the rounded CRD from opposing ends of a dodecamer lie something around 100nm apart, and the whole dodecamer something just over 100nm. THEREFORE – this value (that is 100nm) is used as the standard and all molecules are aligned at that 100nm dimension and are cut into 1 nm vertical segments, centered and re-exported as 24bit rgb images at 500px in width.  Distances between peaks and valleys along the arms are measured against the 100nm. It appears that exporting as 24bit rgb at 72 or 300 ppi tif images provides almost identical LUT plots given the same width (500) and height (20) pixel rectangular samples across the same image (at both 72 and 300ppi). However exports to 300ppi tend to minimize the effects of slicing and centering the original image.

2: No absolute values for greyscale luminance (also called brightness or intensity: measured on a scale from black (0, zero intensity) to white (256 [28]levels of luminance; grades from 0 to full intensity) exist in the images of SP-D dodecamers as posted online. Some are rendered in black and white from the original color of atomic force microscopy, others are actually shadowed and exist only in black and white. Some are converted from greyscale into RGB with no color saturation, others are converted from rgb to greyscale. Manipulation of the images (image processing) by the authors contributes to the greyscale attributes as well. I have also adjusted the contrast somewhat from the original publication images. It seems that an SP-D dodecamer photographed with AFM, exported to greyscale and analyzed with ImageJ (which plots greyscale values in its Analyze>Plot Profile menu shows a plot with its origin at 50 on the ordinate of a LUT plot,  which is about 20% luminance.

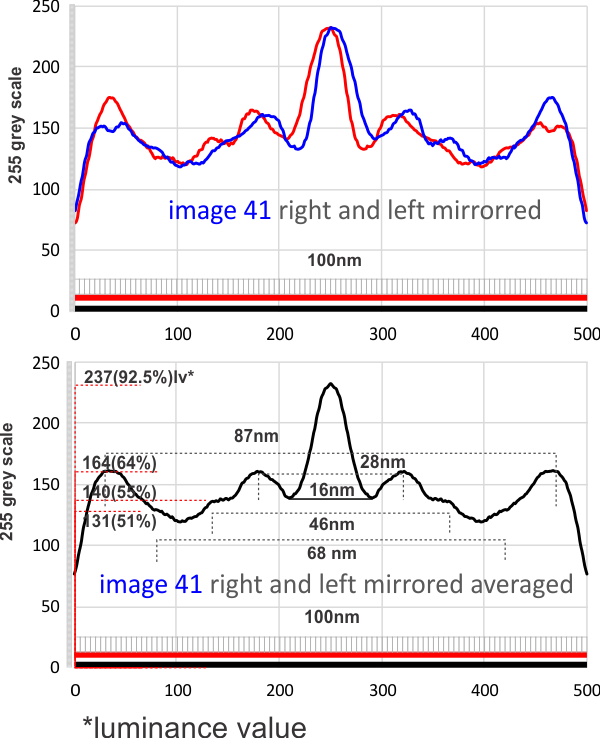
Below is a plot in which 4 arms of a dodecamer of SP-D have been plotted for luminance, separately then averaged (TOP) and then vertically mirrored (8-10 plots total) and averaged again producing a symmetrical summary of a single SP-D molecule. There is a peak of about 159 lumens for the center (above the the 77 lumens background), 87 lumens for the first peak,  61 lumens for the middle of the 3 alleged minor peaks, 54 lumens  for the smallest most lateral peak  between the N terminal and the CRD and 88 lumensfor the CRD.


POSTED BEFORE:
1- central bright region 8nm and 94% brightness

2- First valley around central bright region 14nm and 121 grey scale brightness (47% brightness)

3- First peak on either side is 30nm (15nm on each side of center) and 71% grey scale brightness. and others can be seen…. three peaks between the center and the CRD.

Twitter and Facebook as Ego Strokers: not good for meaningful conversation

Twitter and Facebook: I was interested in a nice little pair of words that i heard in a YouTUBE video by Jordan Peterson and Ben Shapiro: Religion, Trans Activism, and Censorship: that these media platforms are just ego boosters. It is pretty apparent that these in fact are that–instant ego gratification platforms when one can look and see who likes you or agrees with you. They are not profitable conversations, they allow explusvie, anonymous blurbing. BUT they do stroke the ego. The intercourse is not really a conversation with another human. It is binary, polarizing, and splits groups into opposing moral, social, intellectual and political views (binary, ok whats new in the universe) that profit no one. (here is one opinion on the topic)
The ego-boosters and the ego-busters (words coined by Dr Suzanne Gaddis) are great names for the Democrats and Republicans. Haha, very little is exchanged on these platforms, in anonymity that benefits the world.

TAKE HOME MESSAGE: todays twitter and facebook platforms allow both ego-boosters and ego-blasters anonymity while engaging in self-aggrandizing self-ego-stroking. This may amount to braingasm (what a cute word).

3 LUT plots, 3 cuts, 3 measures: one result

Six measurements of SP-D (molecule randomly named 41, someone elses AFM image) where the four arms were subjected to three different dissecting techniques.

1- causal trim of molecule before centering 1nm slices, centering exporting to tif, rectangular select and analysis of LUT values,

2 – more careful but not aggressive trimming of same SP-D molecule centering 1nm slices, centering exporting to tif, rectangular select and analysis of LUT values,

3 – latter molecules more carefully trimmed but a single line value for LUT.  The 6 plots were superimposed (adjusted to 100 on the greyscale Y axis and 100nm on the X axis.

All images were exported to 500 data points (pixels) in the excel file but are equivalent to 100nm over the length of each of the two sides of the dodecamer arms.  There is little difference between the tracings. Finding a summary plot from the columns in the excel file will provide numbers to determine what level of grey scale difference is significantly different from the base line which appears to be 55 or 60 on the grey scale.
1- central bright region 8nm and 94% brightness

2- first valley around central bright region 14nm and 121 grey scale brightness (47% brightness)

3- first peak on either side is 30nm (15nm on each side of center) and 71% grey scale brightness. and others can be seen…. three peaks between the center and the CRD.

What ratio of grey scale change is required to define a significant elevation in AFM images?

AFM is a “depth” measure for molecules. I found a reasonably good article which led me to believe that with sufficiently detailed look up tables for an (well maybe several) SP-D molecules that a 3D image of a dodecamer could be created.  I took just one AFM microscopic image (I cant remember whose image it is, but give them credit for this image, it is certainly not mine) and it may not be the ideal image to analyze, but that makes it random and not given to my own particular analytical bias. This article is found here. afm_introduction

My thought now is to figure out a way to define a significant change (peak) in grey scale in terms of LUT tables generated using ImageJ.  Image below would indicate that if the image is normalized to 100nm from end of CRD to the other (two arms of the dodecamer shown) and repeatedly sampled with different images (individual dodecamers) that using the brightest peak (the highest point in the molecule) normalized from background (which is right around 50) (wikipedia says:In photography, painting, and other visual arts, middle gray or middle grey is a tone that is perceptually about halfway between black and white on a lightness scale (119 119 119), however each AFM background is different though all could be adjusted to what the background is on the image here: about 40 40 40 so the beginning of the molecule is around 50 50 50. This gives just 200 steps of grey in which the peaks and valleys of the molecules rise and fall, with a clearly middle point common to all dodecamers.

It seems that if the scales are all normalized to 200 grey steps (assigning whether there is a significant difference in peak height, peak distance). Back to basic numbers. Image below has 100 cuts, and plots and height of AFM standardized. 

Middle and late pan apoptosis in livers of 14CoS ko mice

My quotes from an email to the PI of this project on 14CoS-/- mice treated with NTBC and withdrawn from NTBC. The electron microscopy on liver’s of these animals was really fascinating. Pan-apoptosis.”

Take a look at the nucleolar structure, the dense body (likely denatured DNA and RNA) right next to remains of the a nucleolus and “notice” the regular pattern of striping (lower image, enlarged from square in right hand image above. Left image, earlier apoptosis with lace looking nucleolus with lots of fibrillar centers, and right, fibrillar center with dense RNA and/or DNA probably laddered.
hepatocyte apoptosis in 14Cos Ko mice

“NTBC withdrawal in 14CoS/14CoS but not in ch/14CoS mice leads rapidly and progressively to apoptotic changes in hepatocyte nuclei. Early apoptotic changes were not associated with inflammation, however after 48 hrs some polymorphonuclear cells were present in the sinusoids. Isolated apoptosis need not induce an inflammatory response, however, when more three quarters of the hepatocytes are in some stage of apoptosis, the absence of inflammation is not a realistic expectation. The endpoint of both apoptosis and necrosis is in fact the same, cell death.” ”

“Mid-apoptosis is defined as hepatocytes where nuclei exhibit considerable peripherally condensed chromatin and unusually large nucleoli with very prominent fibrillar centers. Late-apoptosis is defined as cells where nuclei are pleomorphic in shape, have large clumps of chromatin condensed radially, an intervening nucleoplasm without texture, and show a disruption of nucleolar aarchitecture. Necrosis is defined as a swelling lysis of the entire cell, loss of membrane integrity, with debris everywhere. All histologic assessment was done using a blinded protocol. Percentages were calculated by dividing the number of apoptotic (or necrotic) cells by the total number of hepatocytes counted (>500 hepatocytes per animal), multiplied by 100.”
I am not sure how many or which of the countless images of hepatocyte nuclei ever made it into a manuscript but here is one image below where mitochondria have a very peculiar transformation.

Infochasm

Infochasm: the exceedingly great distance in knowledge, comprehension and terminology between two scientists, which increases in proportion to their lousy communication skills.

inforchasm is the depth of the division between scientists and their fields

This is an awesome new word created by “moi”. Perhaps infochasms exist in all vocations, that is, the linguistic nuances of new and repurposed words used to describe specific items in a specific field. “speaking in tongues” perhaps, or analagous to the language problems of “Babel”. 

When I speak to my colleages, even those with whom I have published scientific papers in good journals, I find they don’t really understand me or my “points” and I don’t really understand them and their field, not because of the complexity of concepts, but mostly because of the additional definitions that words gain over time, the infinite amount of information available, and because of word useage, order, definitions and language nuances.

Could not resist blending these AFM and STM images

The difference between AFM and STM has been explained to me before and there are a couple informative references online but I have not sufficiently studied their differences to understand why the images of the compound here…. also which I could not find a name for but is some kind of tri-dibenzo[b,ghi]perylene, or at least that what i guessed at.  These two images, shown below, didn’t seem to look very much alike – measuring different parameters but I wanted to merge them into something that was closer to the line diagram above.  Wich, lead to the image at the bottom.


I guess this is a planar molecule since i think the testing has mostly been done on such, but you can see that this particular molecule merged shows a little bit of a different pattern on the right hand side than on the top and bottom portions on the left…. likely just slightly tilted. Sadly this makes no sense to me, but using both techniques at the same mag, and merging might help someone understand the differences in the two images.

I laugh, all this in the course of trying to find AFM of large protein molecules to test my imaging approach to SP-D.

After years of service, sir, we don’t need you anymore

I had insight (I guess that is what it was (don’t know for sure) about why I hate this University and Department so much. It might actually be part of a grieving process, almost like death or divorce from someplace (someone) that I worked for/with/in (and still do) 50+ years. (yes 50 years from 1968-to date — which is 1/17/2019. Feeling of being rejected or abandoned after much devotion and dedication. And then, I get an email from an office worker (which I put in the category of “yes” man) that a former faculty member has died. (That office worker has shown me nothing but disrespect (maybe shows all personnel the same “i do what the chair says so I am in charge, i don’t need to be civil or show compassion, you must do what i say” attitude) …. The email was a one liner, no beginning date for his service, no comments on his research, no checking to see even what division he made his contributions to, no gratitude for having helped to build the department which funds her job.

grief image

Less than one line… wow… I am instructing my only continuing contact in the department NOT UNDER ANY CIRCUMSTANCES SEND AN EMAIL OUT TO OTHERS WHEN I DIE… I would rather remain nothing… than be give such disrespect.

I send silent words to the security camera each day when I come in… read my lips.
Here is an article which actually confirms my feelings today. Hallelujah, I am at the next to the last stage….I quote them:

Denial: “I never really wanted to retire… I should still be working” (yep i went back to work on a Breast Cancer Grant for 5 years)
Anger: “They made me retire… They wanted me out of there… So-and-so set me up” (yep, forced to retire because my external support dropped below 80% — btw tenured faculty don’t have this threat)
Bargaining: “Maybe if I just _________, I could go back (or move on)” (yep, continuing to do research, coming in every day wanting not to be here)
Depression: “Who am I kidding, I’m worthless and always was” (yep…no way to get collaborators or exchange new ideas, no funds for publications or research)
Acceptance: “I felt lost at first, but finally feel at peace with my new life” (not yet…. waiting….. ha ha)

Simplest test

THis is anthracene – scanning tunneling microscopy by Bohringer and colleagues which has replicate images.  It is perfectly obvious that a striaght line or rectangle and looking for peak height of grey scale is not going to give an accurate picture using ImageJ since sadly there is no option for drawing a line with a “node” for bending or adjusting the curvature of the line. Writing this into ImageJ would be impossible for the non-coder, but likely would be an easy task for others.  If one wants to draw individual diagonal lines to compare with the LUT for a straight line however it is a fairly easy task.  Because anthracene is so symmetrical it wold appear that not a lot of “remapping” is required.

In this particular case, cutting and centering the image (as proposed for curved molecules) would not create an acceptable dataset. Just taking a few minutes to examine this molecule with ImageJ makes it pretty clear that for large assymetrical molecules using the arc angle and cutting and centering might have some usefullness because of the speed with which the LUT analysis can be accomplished.

These anthracene images (7 images below) appear very regular but there is a little bit of distortion angle to all of them, I but do not possess the expertise on STM or chemistry to say if this is artifact or not, but anthracene appears to be symmetrical. Red line is obviously LUT values straight across the molecule, upper and lower plots are 4 individual plots taken using ImageJ from edges of peripheral bright spots diagonally to the dark area in the center of the molecule. (i.e. four separate lines and four separate plots from upper right and left and lower right and left to center).

I added another diagram, because while the paper from which these images were copied says that there are a host of possible influences on the molecules being examined, and various changes in the appearance can take place. This image is what I believe is their control however, and i see no resemblance between their STM images (left and copied underneath on right) and the ball and stick diagrams overlying their STM images. ha. Most notable discrepancies in model and images occur at ends and in center.
This image using STM (paper found here) is a more understandable to me, at least there is repetitive symmetry of the five rings between the ends. It ispentacene/2 ml NaCl/Cu.

Testing the plot profiles (LUT) against linear DNA

I searched AFM images and found this article bu Alice Pyne et al, which purports to observing differences from classic DNA helix in their images. They did this using some refined AFM techniques which I didnt read carefully, but did see plots for LUT for some images. I was particularly interested in verifying the ease and efficacy of the simple cut and center method for looking at variations in brightness of TEM images of molecules and thought I would test out my method on their images.

Firstly I was a little disappointed in the materials and methods….which stated so briefly “molecule digitally straightened” that to me was a red flag especially since the “digitally straightened” molecule was also considerably changed from the original and this opens up the method to the creative interpretation of the “one who digitally modified the image”.  The latter is not in and of itself bad, it just needs to be spelled out in the methods section.

Had I not spent years fussing with images I might have just passed this off, but because i want a quick, unbiased, reliable way to quantify and semiquantify densities along the length of a molecule(s) many of them in fact to determine whether peaks and valleys are a matter of preparation bias and technique.

Bottom line here is that my transparent and pedestrian approach to measuring nm distances between bright spots and dark spots works just as well as their method…. and it is totally transparent and can be reported in the materials and methods.

In the image above, their plot (superimposed over their digitally modified image (the technique of which could have entered bias) next to the simplest, not even straightened molecule which i sliced into 1nm slices and centered (taking all of about 3 minutes) exporting the image to tiff and analyzing using a rectangle in ImageJ) produced very similar results. My own blue line plot (copy of the red line plot in the molecule that cut and centered) is so close to their two superimposed plots as to be startling.  This certainly confirms my use of the cut and center approach to straightening molecules for LUT determinations. The most serious fall back i can see is the final length of what is assessed and bringing that into the correct relative proportions can be achieved by taking the arc angle dimension for length and stretching the image thusly.