This surfactant protein D trimer is from a publication by Arroyo et al, and the purpose of my measuring their image is to determine whether the Ntermini of SP-D multimers is created by side to side Ntermini connections, or end to end (i think most likely the former). I am measuring trimers and hexamers to see whether in the same micrograph (super important that they be from the same image since i have found wide variation in the micron bar markers and SP-D molecules in their respective images, and have on the whole decided that 100nm is not what they really — but have found the biggest discrepancies are in estimating the trimers and hexamers which are larger than expected. Nterminus is on the left, CRD is on the right.
so here is a “classic pattern found in lightness (brightness or grayscale) with Nterminus with collagen-like domain peak 1, 2, 3 and with possibly a 4th peak (maybe the coiled coil neck) and a very typical lumpy CRD. These two LUT plots were from an unstraightened trimer using a single line (in ImageJ) and the plot below was using that same image cut out, then centered, and then exported and analyzed for grayscale using a rectangle. It is easy to see that the accuracy of the plot, particularly in the CRD region where the three separate CRD are actually visible as rounded lumps on the C terminus end of the trimer.
\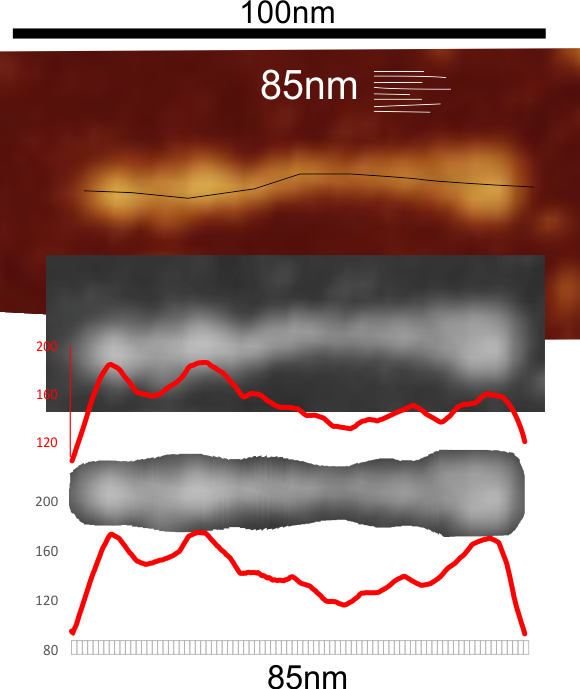
So tip image, is their micron marker measurement, and their original image, my grayscale export to tiff and the line plot from ImageJ, made to measure what 85nm that their micron bar says it is. Lower image is my trimmed, and cut into 1nm slices, centered exported to tif then analyzed in ImageJ to provide the LUT plot below. The bottom is the smoothest and hopefully the most informative. It is fair to say that this particular trimer is longer than the others in this micrograph, which means to me that something scrunches up on itself when not paired with another trimer.