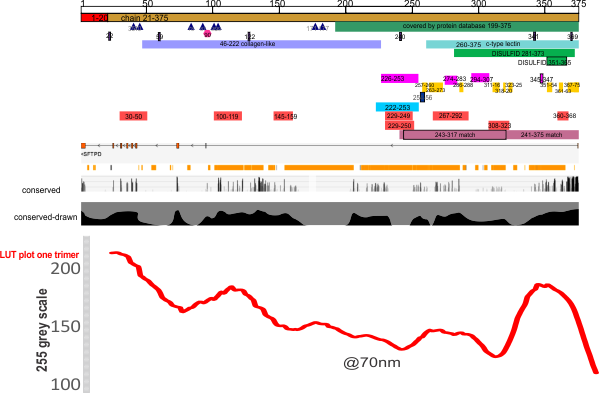
When i looked at RCSB for SP-D and noticed the trends in the conserved regions of the SP-D protein I noticed that the highly conserved regions were an iteration of the “highs,” “bright spots,” aka “peaks” in LUT tables. It made me stop and wonder whether the protein configuration was really that closely aligned to the peaks in brightness seen in the AFM images (right down to the concensus curve (red line) that I have generated for a group of 6 – 8 hexamers) and what is also seen in the many LUT plots for AFM images not included in this concensus curve, and even some of the rotary shadowed images of SP-D. Coincidence?
Looking at images of SP-D from other species and mutated SP-D and other collectins with the straight collagen-like domain and neck and CRD domains will tell. At any rate, I thought it was interesting enough to take the time to create and match the curves to the data.
Upper part of this graphic is UniProt, conserved line in the middle is from RCSB, the black line is my vector line drawing of the conserved sequences, and the red line is a composit from actual LUT plots for SP-D, with the Nterminus on the left, collagen-like domain towards the center and the neck and CRD on the right. The LUT scale (1-255) is the Y axis on the right of the SP-D LUT plot.
Bottom image is the whole UniProtKB-P35247 graph
