Monthly Archives: September 2019

More sticky CRD in SP-D multimers

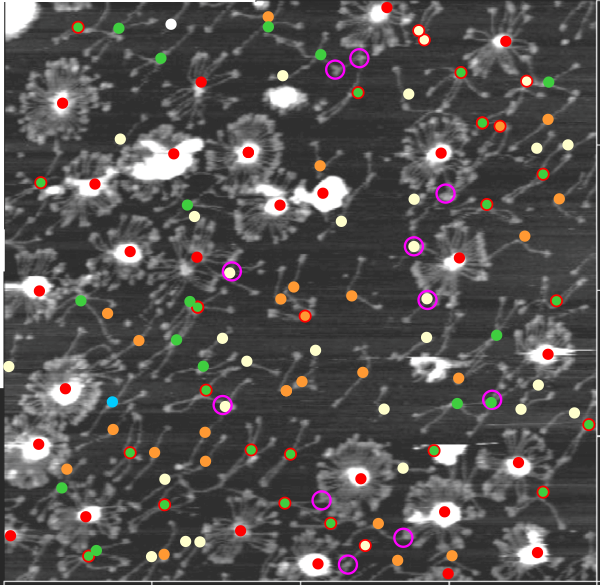
In many cases the CRD domain is in side to side proximity to other CRD, but sometimes the CRD is end to end or end to side with Ntermini as well. Some of these occurrences are denoted with a pink ring. Not all the molecules of SP-D in this image of Hartschorn et al (Respiratory Research) were marked, but the obvious trimers, one nonamer
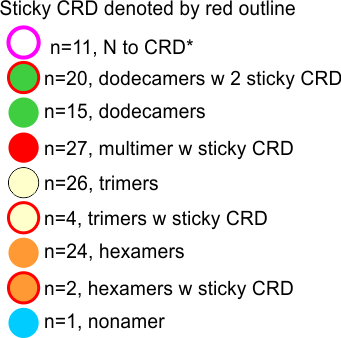
, lots of dodecamers and fuzzyballs were marked as to whether there were CRD which appeared to be in very close proximity – according to this legend.

100% of the higher order (Mmore than 8 arms) SP-D multimers have sticky CRD (24/24); and about 57% of the dodecamers have sticky CRD (where two CRD come together in close proximity (and are bent and otherwise pulled with each other), 13% of the trimers have CRD touching some other structure (CRDs or Ntermini), and about 7% of hexamers touch something as well.  Overall a third of the SP-D molecules have CRD that touch another CRD or an Ntermini –at least as it appears to me in this image.

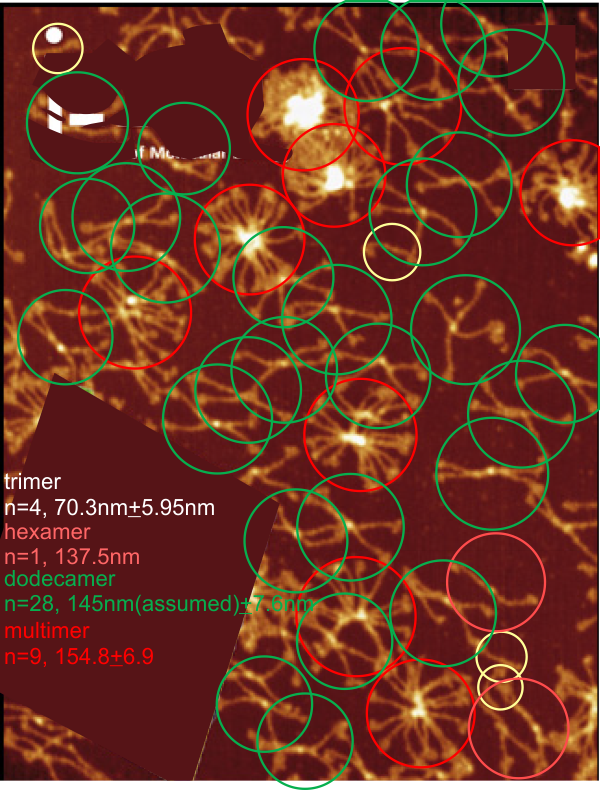
Each of the 4 species of oligomer (except nonamers) are about 1/4 of the population. (thank you to Hartshorn et al)


Sticky CRD appears to be part of SP-D multimer images

I have wondered about this observation for two years. Why are the CRD in multimers (and also sometimes dodecamers) somtimes arrayed in an obvious “lineup”.  Very often the CRD in separate trimeric arms that are adjacent in the outer sphere of fuzzyballs appear to cling together. Also, there are events which (maybe during processing only, i doubt anyone has mentioned it because it could have been a processing effect) where many CRD seem to be aligned and the angles between the aligned arms is obvious.

In all microscopy (and in all other media preparations, bar none) there are admittedly artifacts which appear.  Here are images from a couple of authors, separate procedures, but the same obvious event.  While it may be accentuated by processing, my guess is there is more to the CRD clinging than one wants to contemplate.

AFM is not my field of microscopy, but there have been few artifacts that i have seen in TEM that dont also provide information about cells and tissues in general.  Moreover, in LM, the artifacts are horrific, yet they are given credence daily by a host of pathologists.  The sticky CRD are a clue, to what? It is obvious too that the greater the number of trimeric arms, the more apt there are to be groups.

Below find a montage of SP-D images from various authors upon which i have marked the most obvious “line like” associations of CRD. Just for convenience they were standardized to similar diameters (@ 150nm is a good estimate).

Trimer, hexamer, dodecamer, multimer sizes from SP-D cover image

Using 145nm as the standard diameter for SP-D size (averaged from about 14 other “measurable” dodecamers from AFM), the diameters of multimers, hexamer, and trimers in this image are shown in “relative” size to that standard. I did just the dodecamers in the previous post but thought it would be nice to know the relatives sizes here, even though absolute dimensions in nm is not really available. (aside:  no one seems to put an accurate bar marker on their micrographs (self included) anyway, so a relative measure is probably the most informative anyway). The nice info here is that the multimer is significantly larger than the dodecamer which should NOT be if all the Ntermini are lumped in one central unit (something which i have doubted for a long time), but rather forming a small central ring with side to side links. The t-value is -3.31472. The p-value is .001071. The result is significant at p < .05.

Adding more observations will confirm or refute.

Finding SP-D measurement in cover image

For this cover image, mean diameter (here n=24 dodecamers that can be measured with a perimeter of a circle touching the CRD of three of the four dodecamer arms) will be adjusted to the scale supplied by AFM images for which there is a micron marker. The mean diameter of dodecamers from 10 images was 145nm, (see previous posts) and will be individualized for each dodecamer here when analyzing height (LUT) plots.

Does processing of low res SP-D AFM images change the data?

145nm +/-10nm is the current mean and SD of dodecamer arms (measurements of 41 different dodecamer arms from AFM images from Arroyo et al) and the image here which is from a low res cover image of SP-D molecules (also Arroyo et al), to which a Gaussian blur with a pixel radius of 3.5 was applied, and contrast increased, brightness decreased manually. Two opposing sides of a dodecamer (two trimers joined at Ntermini) were trimmed identically, cut into 1nm strips, centered and exported as tif files and a rectangle plotted in ImageJ.
The LUT plots for these images — that is, gaussian blur and centering and contrast enhanced vs a screen print of the same dodecamer from their cover — are virtually identical, one pixelated one more pleasing, very little change in anything except smoothing of the LUT plot and more pleasing visualization.
CONCLUSION: gaussian blur doesnt change the image grayscale data (obviously absolutes yes, but not relatively) and the centering makes data easier to plot in ImageJ. Thus, except for the fact that the original cover image does NOT have any micron marker and the diameter of the dodecamers will be summed for an average size for those images only, they are still acceptable in a database that will be used to determine whether there are three or four LUT peaks (height in AFM) in the collagen-like domain. plots on top left, rectangle of centered images, plots on top right, freehand line where the peaks are chosen during drawing. One can see that the centered freehand has a higher peak value than the rectangles. The problem with freehand is that it does NOT represent an unbiased assessment, nor does it reflect the average over the vertical 20-25 px. The good news is that there is no method which obliterates the data, thus whatever method you choose to analyze the peak heights (brightness as percent or 0-255) you will likely have reasonably representative results.

Big differences in arm-length of this particular SP-D dodecamer:

Images such as this one (from Arroyo et al) show perplexing differences in the lengths of trimeric arms. I measured these, and plotted their peaks and clearly the plot on the right hand side of the molecule (in this image) is quite expected. peaks 1, 2, 3 for the collagen like domain and a nice often lumpy CRD, and a neck region that is somewhat low height (brightness), but can show up as a small peak. The left hand side gives pause to what actually constitutes the Ntermini junction. It looks as if there are two Ntermini side by side not end to end. Even then however, the peaks along the other domains of the SP-D molecule just are not present in this image to the left of the bright peak.


Image shows (top) Arroyo’s original image, green bar at 100nm from their bar marker, my outline of the portion of the SP-D dodecamer cut out for LUT plots, then cut into 1nm vertical slices, ungrouped, centered horizontally, resulting two trimmed arms of the dodecamer. This image was exported as a grayscale tif  and imported into ImageJ, with rectangle from end to end used for plot analysis  of grayscale brightness (blue line with brightness (0-255) on the left. Peaks are named N, collagen-like domain peaks 1, 2, 3 and the least bright portion of the coiled coil neck domain (not labeled) and the CRDs on left and right but there is no assurance that the N terminal is not seen as two peaks one in each of the longer arms.  There is little bilateral symmetry in this dodecamer. A possible real-time shortening of the arms on the left of the image might result from the molecule lying over itself, or some error in protein production or defect in processing for AFM.

One comment against deep bending of the two arms of the dodecamer on the left hand side of the image is that the CRD on the left is actually brighter (higher) in the AFM image than the CRD on the right hand side of the image. But, the 1 and 2 peaks of the collagen-like domain may overlap making for a very high peak and very bright….  guess?

This plays into the dilemma whether to equalize the two arms of the dodecamer when doing morphometry or not to equalize them.

SP-D: a consistent valley in brightness in AFM images

This valley in LUT plots in SP-D images is very consistent, presumably it is the more tightly wound “neck” region of the molecule. The CRD and neck and part of the collagen-like domain from left to right, red arrow at the low point. This means that the collagen-like domain is disproportionately elongated in terms of the whole molecule. I am aware of the numerous articles that go into great detail as to the CRD of different species and their effectiveness in innate immunity. This particular image the valley is quite pronounced. In various LUT plots, there is a valley and gradual rise in peak to the CRD. The thinness of the LUT at this point as well as the valley could indicate a tighter winding of the neck and a looser winding of the collagen-like domain, and thus help someone produce a molecular model of that region so the complete SP-D can be imaged. This image from Arroyo et al.

SP-D dimensions

7 dodecamers, each arm measured with a vector line each node measured separately. Images are AFM from Arroyo et al., randomly selected.

n=14 (two arms each); 144.49nm +/- 7.02nm

Diameter circle;  n=7, 139.79 +/- 3.14

USING an online t-test calculator the two methods are not significantly different at the 0.05 level, but close, with the diameter always underestimating arm length using the three CRD touching methods.  p-value is .062519

3 SP-D dodecamers: vector length of arms

There is such huge variation in the size of these molecules and the size of reporting that it becomes difficult to measure where the height-peaks (LUT) and bright areas are. I have used an un-glycosylated SP-D molecule image, and 3 molecules at pH 7.4 from oft cited paper by Arroyo et al to see how much variation there is.  Vector lines, then broken and measured in parallel dimension, summed and using the bar micron marker in the publication the nm diameter and arm lengths were determined.

Mean of 12 measures (one for each arm and one for each diameter) to arrive at: n=8 arms of 4 dodecamers, plus 4 diameters: 143.8nm+/- 6.97nm. I am more than sure that adding more will change this value. But for now, anyone who wants to examine the process… here is the image.


Wake of Dispair

Never give yourself away

As you enter the room

Don’t be seen

Searching in the suitcase

They want lunchtime chatter

Relying on their conventions

Not reading the currents

You are the one with

A past. I will wait

And hope

That the buffeting

And forgetting will

End, sparked by

A kind of desire

Satisfied by glimpse

Of you

That will leave a

Wake of despair

RLB, 9/8/2019