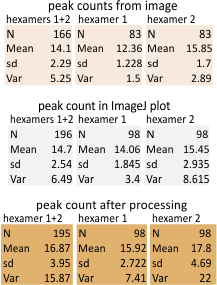
Finding peak height and width from image plots (ImageJ) and signal processed plots (Octave and Excel templates) can be done, but by and large, trying to figure out any details for where the markers for the widths of the peaks in the signal processed plots is no better than doing it by hand, EXCEPT for one excel program which is free to anyone developed by Thomas O’haver, and is called PeakValleyDetection. This program allows a new series to be plotted which shows the valley marks on the plot. For me, this is the best program so far for determining where the valleys are “without my personal input”. Looking for valleys and peaks in all other measurements seems to be a mattern of “selection” by the user.


Here is an example. 1) original image and plot using ImageJ, 2) plot from image J smooth using PeakValleyDetectionTemplate-xlsx, 3) comparison plots from my choice of valleys and peaks within the ImageJ plot and the valley choices made automatically by a smooth factor of 11, in the PeakValleyDetectionTemplate-xlsx. They are close. I made some different choices, and the algorithm made some as well. One issue with the xlsx template is that it tends to leave off (or not count) the last peak. I dont think this is a good thing, but I bet that the problem is that it uses a “backlooking” perspective and does not account for the fact that in biology there is so much repetition (mirror, duplication, inversion, tandem, bilateral, etc etc ad nauseum) that iterations of a pattern are not taken into account like they should be. This is one of the reasons that the plots were analyzed as trimers separately.
OK, a new issue just came to mind – and that is a) the segmented line used for plots always went from left to right, and therefore in the algorithms, there may be some bias, whereas with the human eye, probably not. So that begs the question, if i plot all trimers outward from the complete N termini peak, will this change the results in those plots which plotted in the mirror of each other.