
Monthly Archives: January 2023
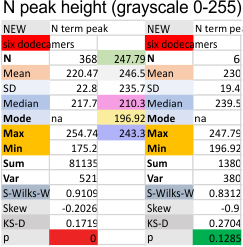
Six dodecamers: SP-D – N termini junction peak height
Same procedure, N termini junction peak height for a selected data set (n=368 trimer plots), for the mean of the select 6 dodecamers (all plots each of the dodecamer images of SP-D). The grayscale values of the individual images, does make a difference in the peak heights…. whick at some point i will try to normalize. But for now, the N termini peak has always, and continues to be the highest peak in the plots, typically close to center (there are very rare exceptions which can be attributed to overlapping molecules in an image.
With an extensive number of plots of the first four dodecamers, the grayscale peak was 238.6 +/- 3.75, so the fourth and fifth dodecamers added did change this number slightly. Clearly the values are influenced by the contrast of each image. I think a “limit range” function (which can be found in Gwyddion and likely other programs for image analysis) could be useful. I am more interested in a quick normalizing of peak height and the lowest point in the plot using a graphics program.
(I continue to thank Arroyo et al, and Thomas O’Haver and my two sons, Aaron and Dan for help with image and signal processing apps.

Six dodecamers: SP-D – CRD domain peak width: present 100% of the time
CRD peak is iconic, present in all dodecamers i have seen except one (not digitized yet) where it obviously just got lopped off somehow during preparation. Looking like it is going to be about 15nm in width which is close to previously measured peak widths for this domain.


Six dodecamers: SP-D – neck domain peak width: with and without undetectable peaks
Same MO, neck domain peak, sometimes visible, sometimes hidden under the floppy CRD domain.
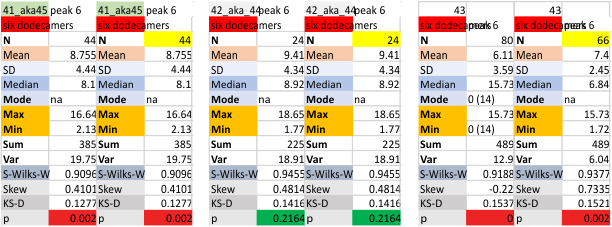
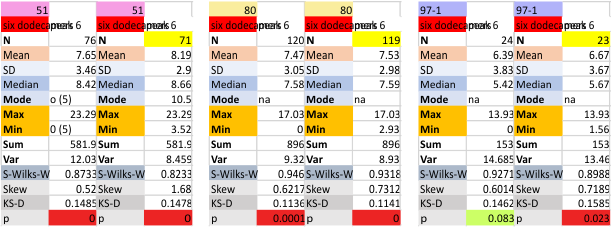
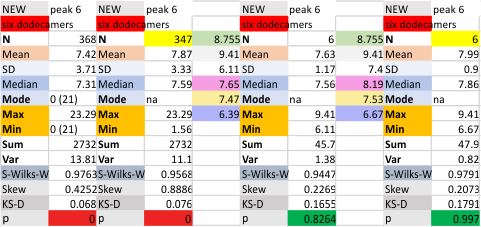
Six dodecamers: SP-D – peak 6 width: with and without undetectable peaks
Same format, peak 6, with and without the very few undetectable (0 values), width in nm, both as individual values, and means of the 6 different dodecamers.


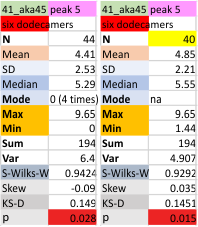
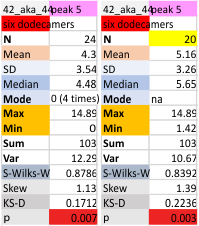
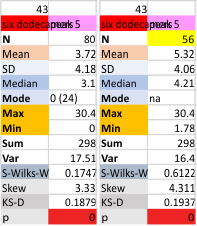
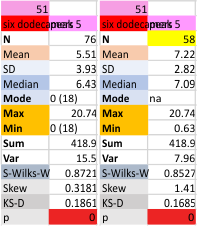
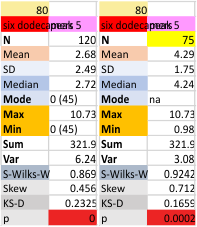
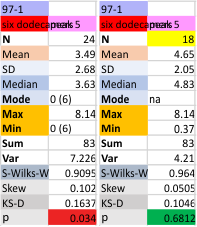
Six dodecamers: SP-D – peak 5 width: with and without undetectable peaks
Peak width for what I have described consistently as peak 5 is given below, with the means found in the current 6 dodecamers (as individual values). The top image shows the peak width even though there are missing values, all values are included in the means and other data. The graphic just below that has the “missing, or undetected” peak 5 values left out of each of the individual measurements. BOTTOM LINE, this peak 5 is likely to be about 4 nm in width.
It is actually a little disappointing to see how little the widths change whether I delete the undetectable values or not, but it is also a good thing, so that I will continue to measure a molecule many times with different signal processing programs to come up with a stable number. 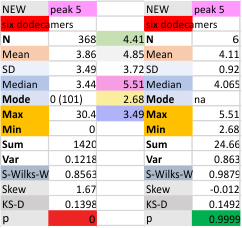
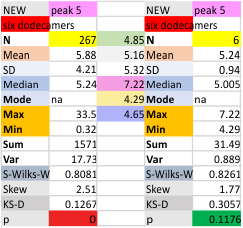 Each of the lower 6 graphics are the individual surfactant protein D dodecamers, just peak 5 evaluated, with and without the “missing, undetectable” peaks as separate evaluations. Each set of values for the dodecamers is given with (left) and without (right) the missing values.
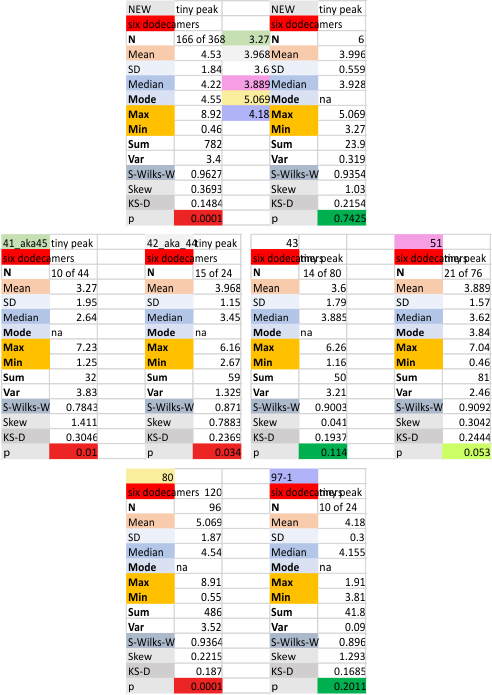
Six dodecamers: SP-D – tiny peak width
This tiny peak (peak 2) in the number of estimated peaks in a trimer of SP-D is very close to the N term peak, almost on its downward slope and very thin, at least typically. This is a peak that I have observed about half of the time so it is easily obscured, if it exists… which i am pretty sure it does.
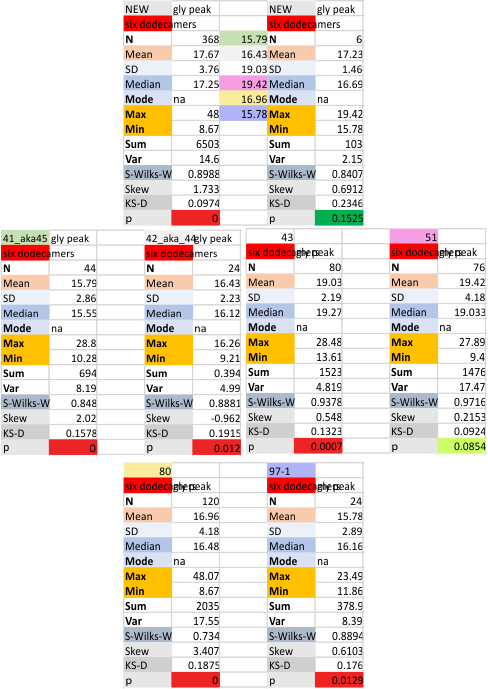
Six dodecamers: SP-D – glycosylation peak width
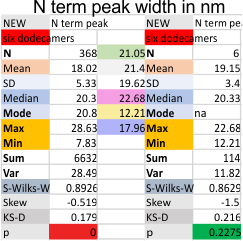
Six dodecamers: SP-D – N termini junction peak width
Six dodecamers: SP-D – N termini junction peak width. The N term peak is a merge of the right and left hand sides of the trimeric mirrors of the peak measurements. The N term peak width was measured on mirror-trimers from the peak height, but these two values were merged to form the width of a complete N term peak width, not just half. Top set of numbers is for all individual measurements (left) and the individual dodecamer values (right) as separate means. Individual values for each of the 6 dodecamers = bottom set of values.
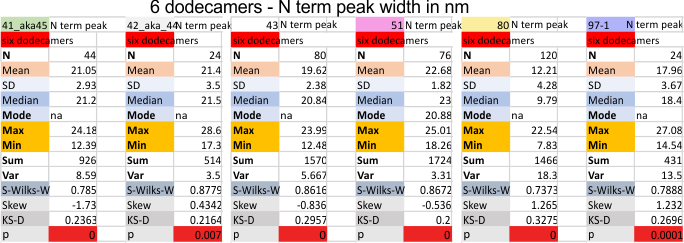 i dont know why molecule named 80 has an N term peak that is so thin… but i checked and it seems to be correct.