Monthly Archives: August 2023

Hydrophilicity (hydrophobicity) plots of SP-D

Hydrophilicity (hydrophobicity) plots of SP-D of five species (human, macaque, rat, mouse, and bovine) are convincingly similar to each other (as are their sequence comparisons) to confirm that a pattern was present in the hydrophilicity of some areas of the collagen-like domain. This led me to see whether the as yet unpublished 4 additional grayscale peaks in an SP-D trimer (1 distal to the N term peak, three proximal to the collagen-like domain (plotted in a direction with N term peak on the left) were “in line” with the peaks in the hydrophilicity plots.  Known grayscale peaks for SP-D are — N term, glycosylation peak, CRD peaks — identified in published AFM images (Arroyo et al, 2018) there are additional peaks consistently found.

Species hydrophilicity plots of SP-D are below (plots are by AA, and not by folding (see tiny green-red-bar for folding) and a comparison of human hydrophilicity plots, and grayscale plots from AFM Images just for human is HERE.


Verge of a Dream: Make someone happy

Trying to make
Someone happy. It
Does not matter if
Outside
a harbor café
our bikes are taken.
We talk across
A straw wrapped
Chianti bottle. Love
Multiplies in cool
Air from a door
Kept open
and unlike
fishermen
soon heading
again
To their seabed,
We’re not sure
How to fit in
the future as
More than needed
Adorns the moves
To make someone
Happy,

SP-D hydrophilicity plot vs grayscale plots – update

The hydrophilicity plot(s) for SP-D from 5 species (human, macaque, mouse, rat, bovine) were found using NCBI aa sequences (whoe protein and regions) and an app from NovoPro. (The plots for SP-D were so similar I in terms of the values along the collagen-like domain that it seemed unnecessary to do more – find these plots HERE). They are shown below, each with the species name and the number of aa is on the x axis. The peak widths that have been plotted for SP-D in previous posts are shown, as well as the “half” N term width. The number of aa per domain does not correlate with the number of nm for the peaks, particularly for the folded CRD vs the linear collagen-like-doman. In addition, because of the “hinge” like link between the coiled coil neck domain and the CRD domain, the CRD portions of the molecule can lie back covering a lot of (if not all of) the neck domain, resulting in non-detection of the neck peak in over half the plots.

Using the length (in nm) of a trimer determined by many many plots, 73nm is the trimer length that I will use.

This works out really well in my opinion, except for the fact that on SFTPD orthologs – NCBI there is a small string of aa that are not part of N and not part of the collagen-like domain, and it fits nicely with a tiny peak found at the valley of the N term peak just before the glycosylation peak.    Graphic below.   Top plot by aa only, bottom plot shown adjusted for now many nm the peak actually shows on AFM images.  Black arrows point to peaks which consistently appear in grayscale plots, which have not yet really been published.  Peaks without arrows have been described.

SP-D hydrophilicity plot vs grayscale plots

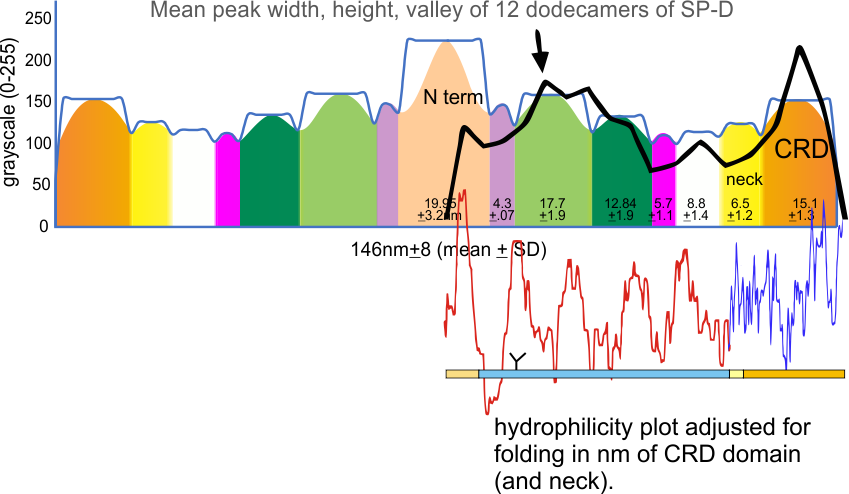
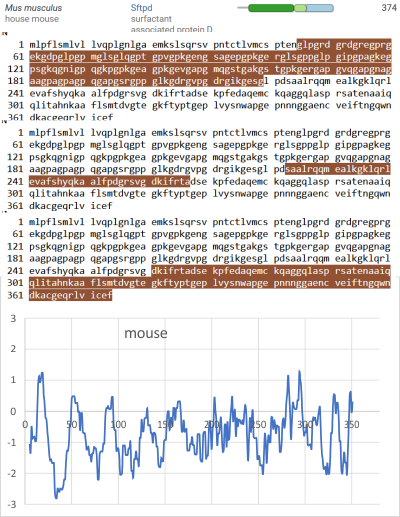
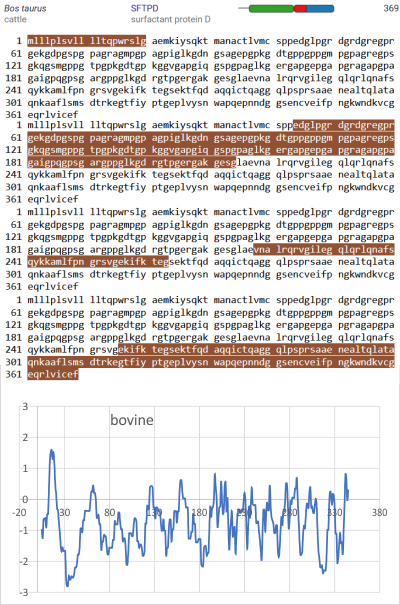
An original hydrophilicity plot (C-J-Guo et al, PLoS Biol. 2008 Nov; 6(11): e266,  their Fig. 1 ) shown here 
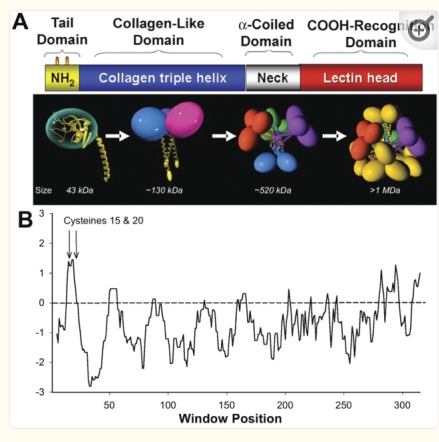
startled me with its similarity to the grayscale plots that seem to be pretty well established for trimers (and the trimer portion of hexamers and dodecamers) of SP-D. The plot seemed to me to be divided into into three distinct peak patterns, one where the N term domain is located (in this case on the right as a very tall peak), a stretch of four large peaks regularly spaced with deep valleys (the collagen-like-domain and with the glycosylation site — the first peak to the right of the N term peak — which they did not identify), and then a dozen irregular low peaks in a stretch reaching the large irregular area where the CRD domain is.  In the legend by Guo et al, they do mention that the dimensions of their 3D models have been changed (shortened collagen-like-domain) for “esthetic” purposes (which for me is an error in judgement and means looking at that part of the figure allows for confusion).

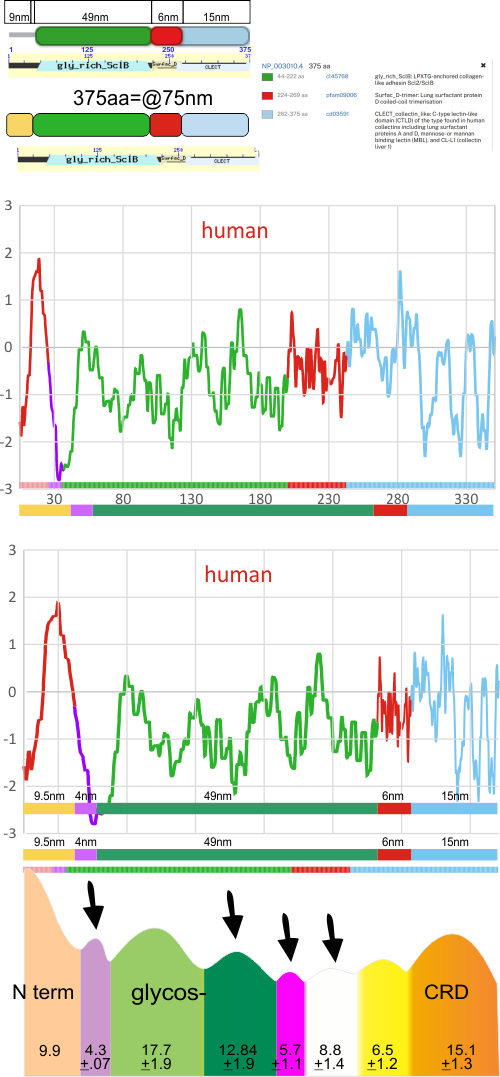
The label above this original figure that names these four domains and shows their approximate length in terms of aa sequence.

One issue with this depiction is that it does not take into consideration the considerable folding that occurs in the CRD domain. This causes the CRD domain part of the hydrophilicity plot to be disproportionately long and the proportion of the straight collagen like domain is disproportionately short.  The actual AFM images of SP-D these domains are not that close in nm of length.

But the possibility of hydrophilicity/hydrophobicity (peaks being hydrophobic AA) being important in the peaks that appear in AFM images was sufficiently similar to compare the grayscale plots with the hydrophilicity plot directly.  There is only one plot  here (meaning there is going to be variation in the plots from various trimers and thus is to be seen as just an n of 1,  unlike the plots of AFM images, but like the grayscale plots, a definite pattern is recognizable).

The main problem in comparing the hydrophilicity/hydrophobicity plot and the grayscale plots is that the latter is measured in nm and the former is measured in amino acid residues.  This means the folding and twisting of the carbohydrate recognition domain would be much longer relative to the the CRD domain which is very convoluted so the whole molecule in the hydrophilicity plots need to be adjusted for nm in the grayscale plots, thereby making a good match for peaks difficult. ( In the hydrophilicity plot since it is measured in amino acids the CRD domain plot would be disproportionately long because it does NOT show its typical folding, and the collagen-like-domain (which is basically straight) would appear to be relatively short.)

It would be an easy task to just go adjust the hydrophilicity plot which shows hydrophobic AA as peaks, to “my liking”,  which is sort of what I did quickly in the image below. It would be more accurate (and a better fit) if I actually stretched and shrunk the hydrophilicity plot by the actual number of amino acids in each domain, then translated that into nm.  Have not done this yet, but here is the jist of what I am pretty sure will show up.  Y in the thin bar for the x axis legend at the bottom of the figure is the glycosylation site, which does correspond to the green peak (glycosylation peak) in the AFM plots.

Verge of a Dream: Air today gone tomorrow

I keep my bottle,
my pauli girl
On ice, staying cold
Between each sip.
I keep my words
For now
On mute
staying quiet
On my lips
I don’t keep my
Love
She keeps me
living light on
dollars, hers
really
from tips.
I keep my thoughts
Together. They
Might like birds
break rank,
Coming on them
In the brush,
They scatter.
I keep my hand
On the throttle
Cause there’s
Air today that’s
Gone tomorrow

rlb 8-20-2023

Verge of a Dream:

It might be an escape
Made because of a
Puzzle. What can be ignored
On a lush island without
Anyone expecting, tomorrow
Is not going to be today.
Or even more attached in
not
Asking for what
Cannot be.
Maybe the slightly raised
Housing left by
departing soldiers is
a reality but not theirs’.
Not theirs when
Just looking without,
Observing
they are painted into
Memory and those
reasons for running
from the prettiness,
from being seen,
and being
observable
Knowing that being
Seen is then
what will be.
To forget facing
A channel and
Gray sky, so
There’s relief
Maybe temporary
But still looking,
alone, there
is a different
Sea.

rlb 8-20-2023

Verge of a Dream: The other side

Whether you are or not
You cleared
your thoughts
so you
might descend the clifton
street steps and let me
like the leaves Fall
away, maybe with
new shoots this April
holding you
steadily on the ledge.
Making it simple to forget.
you wanted peace by
showing one side
only, though that
profile with beauty
and intrigue, was
enough to make someone
sure they must live to
see the other
side of that moon.

Plotting peaks in a hexamer of a “fuzzy ball” multimer of SP-D

Plotting peaks in a hexamer of a “fuzzy ball” multimer of SP-D are problematic at best, and the plots that most coincide with the hexamer plots from dodecamers are “V” shaped tracings making the boundaries of the N term domain peaks hard to define. It is a decision that needs to be made, that is whether to go back to measuring hexamers “within the fuzzy balls” is important to completeing a writeup on SP-D trimer (hexamer) peak number, size, and shape.

N term peak in a plot of a SP-D trimer

First plot of a trimer, for comparing the N term peak height and width in “trimers” vs “dodecamers” shows that the former domain peak to be about 11nm wide where the peak width for an N term in a hexamer is about twice that.  When plotting hexamers which are part of a dodecamer all four trimer N terms domains are present, typically as single very large peak but sometimes with a tiny depression at the top of the peak.

to be sure there is no consistent difference in width between the plots of two hexamers of a dodecamer – hexamers alone need to be plotted.

The peak width of hexamers (plotted as part of a dodecamer – which was done here) is close to double what the trimer N term peak is and trimer peak height is about half the peak height of the N term peak plotted in a hexamer or dodecamer. It looks very much like an area  4x (so convenient).

One other thing to examine on trimers is the presence of a more pronounced “tiny peak” which may be more visible relative to a single trimer than four trimer peaks in a dodecamer.
It will take a lot of plotting to confirm this observation (which now is just an N=1), but certainly it was evident on this image. N term is on the left, plot starts on the left, CRD is on the right (typical two peaks where different floppy CRD might fall during preparation, glycosylation peak is close to the left.  It is easy to count at least 8 peaks along this unprocessed image. mar marker is from the original (Arroyo et al, 2020) at 80nm.