Category Archives: Mitochondria: electron microscopy

odd mitochondira, great mitochondria, electron microscopy and ultrastructural details

Mitochondria – electron microscopy – where is everything

I have been trying to figure out why I am not able to find good electron micrographs which show all the interesting structural elements of mitochondria. Not just the trilaminar membranes that make up the inner and outer membrane portions, and the matrix and the intermembrane space and the granules, those are easy to find. What has been a real hunt is to find mitochondria where there is some element that could be called a mitoribosome (supposedly situated on the inner mitochondrial membrane), or a portion of circular DNA (supposedly situated in the mitochondrial matrix). These are structures in the nm size range and should be able to be seen. Some mitochondrial respiratory chain molecules can be seen – HERE and HERE which might be ATP synthase, but not the complexes I – IV and others. So apparently not much in the matrix such as described as poly-mitoribosomes, or proteins being synthesized (as sometimes can be seen in the cytoplasmic RER gets appropriately labeled.  Diagrams are particularly disappointing as well.

Here is a drawing from years ago, I am going to work to add substructural units in relative size and see if that helps.  cut-away of a mitochondrion, with tubular ER on the right.

artsie craftsie cutaway of a mitochondrion - colored
HERE is an article that answers some of my questions.

55S Mammalian mitoribosome molecular model

awesome model of small and large subunits together to represent the mammalian mitochondrial riobosome. I had a bunch of different configurations but Corel DRAW crashed… so here is just one pix from the protein database website linked HERE. I still have problems finding the exact measurement, and also the approximate number of ribosomes per square nm but I will figure it out. At the moment, something around 30nm diameter is what has been estimated, which should be easily visible with TEM. \

I love that electron microscope is still the go-to tool for looking at these structures initially, usually with shadowed or negatively stained preps.


Isolated mitochondria: looking for all TEM features

Such a huge number of mitochondrial features remain to be analyzed in each of the studies done in the past. Micrographs are available, but few choose to revisit those experiments that were done with care and integrity…for clues that verify or refute the claims made by others about such anatomical structures as mitochondrial pores, the position of mitochondrial ribosomes, the circular mtDNA and oligomerization of proteins from the respiratory chain and or oligomerizations of Bac and Bak apoptotic proteins on the outer membrane.  So beginning with wild type (controls for a GCLC ko mouse study (which has been published – so experimental methods are available online) I will just look at the morphology of mitochondria in images already collected. 20,000x pole piece V, enlarged 4 x, neg 18322, block 78149, postnatal day 14 mouse liver, +/+ single isolated mitochondrion taken from the lowest section of a pellet of isolated mitochondria 6 21 04. (two mitochondria from the same micrograph, not identical enlargements)

here is a snapshot of the lower right hand corner of the above picture with two mitochondrial RNA models superimposed at approximate scale, the one on the left, yeast, the other ? maybe mammalian.


What is this?

The most common title for any post on this blog is “what the h*** is this.

This is an actual diagram, so bad, so unbelievably bad, that if you showed this to me as a microscopist i would laugh out loud when you told me what it represented. If i were an artist, I would laugh out loud saying, well, you missed the boat.  I am not being mean, or nasty, just sitting here incredulous at this red and green and blue thing that in no way depicts what it is supposed to represent.  it is fake-news.  it confuses, and undoes what one is trying to learn, it makes reading a scientific article much more difficult.  What is it about scientists that makes them unable to represent what they study in pictures…. what is it about artists that cannot comprehend the concepts that scientists are trying to portray.

This diagram is sjpposed to be a 3D representation of a tubular crista from a mitochondrion from muscle tissue….  i wont even tell you what it looks like to me…  There is fake 3D modeling of the membrane, and the red and white and blue lines…. are supposed to be WHAT?   I have looked at tens of thousands, maybe millions of mitochondria with TEM and this just makes me cringe.

Get with it you scientists…..  inform your artists and diagrammers, think about how and what you are asking them to represent, and check to see if it matches “reality”…pay attention to the figures in your publications lets you do something like this.

Puzzling? structures with structures

Aside from the fact that the word “structure” has been usurped by the molecular biologists from the microscopists, both show structure. The new puzzle is to fit the two together. I personally know nothing about protein structure but know a little bit about cell structure… so the deal is to find where the two can become one.  This of course is now accomplished by computational microscopy and better resolution, none of the equipment or funds for me to play with, BUT i still enjoy finding what is available online and working to understand that about which I am curious.

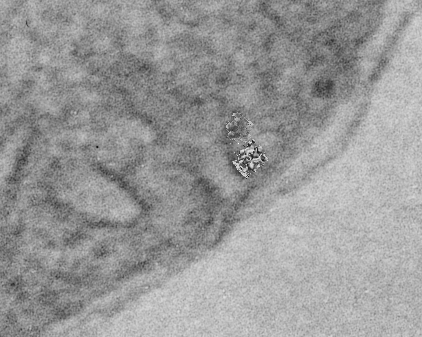
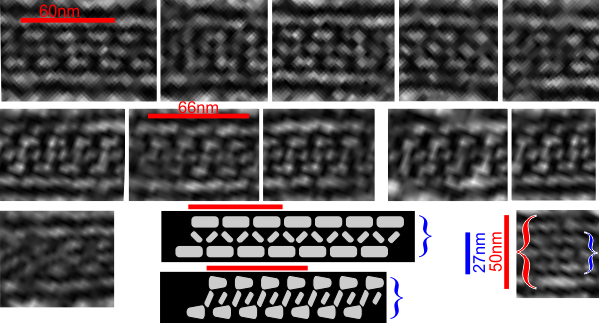
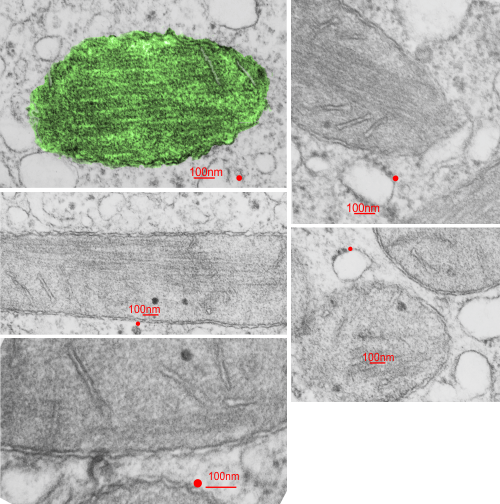
Beginning with the paracrystalline proteins in some mitochondrial disease states it became a puzzle to try to solve: that is, what proteins are making this brick-like inclusion in the matrix of mitochondria (see previous posts).

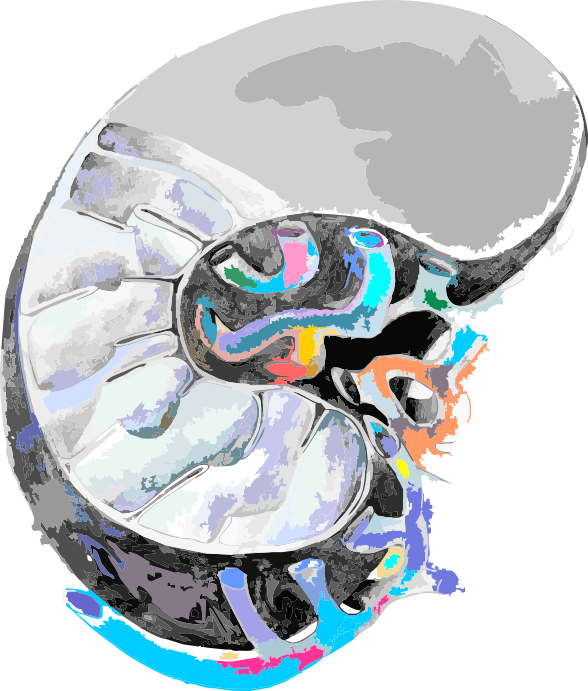
Just beginning with — Complex I (NADH:ubiquinone oxidoreductase) critical to energy metabolism in mammalian mitochondria on the inner mitochondrial membrane I used RCSB PDB to play with the purely “visual” issues of the protein. First diagram below…. shows a band in the transmembrane portion which by my eye is quite different than the rest of the structure in terms of color – and therefore leans toward hydrophobicity (according to the coloration charts of RCSB PDB). This model (which is to be taken “generically” of the NADH ubiquinone oxidoreductase I have shown on as a view from the nominal R and L (the bumby lump (arrow with no text) which I am assuming from the pale color is neither hydrophobic nor hydrophilic? just above the intramembrane “box” on the L). I doubt there is a “right or left” but for descriptive purposes, the front back – right left has been shown because they are so different, except for the transmembrane portion which is clearly a band that goes through and through. The inner mitochondrial membrane is from a diagram I did earlier… but gives a suggestion of the orientation of the NADH ubiquinone oxidoreductase that i have found for this in other diagrams online.

So now to add some other diagrams which give more fun images. This one, oriented identically to that one above, shows alpha helix area (bright pink–also according to the charts of the RCSB PDB viewer guide) that is within the bounds of the inner mitochondrial membrane. When one rotates the ribbon molecule, they are all neatly aligned perpendicular to the length of the membrane. I have to assume that they fit within the lipid realm of the trilaminar membrane.

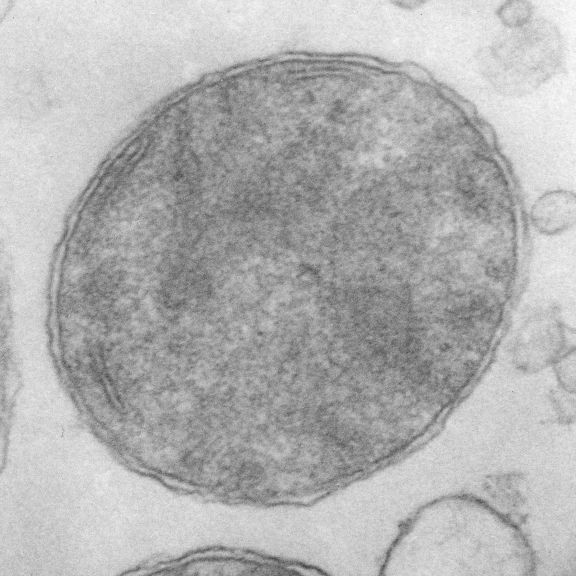
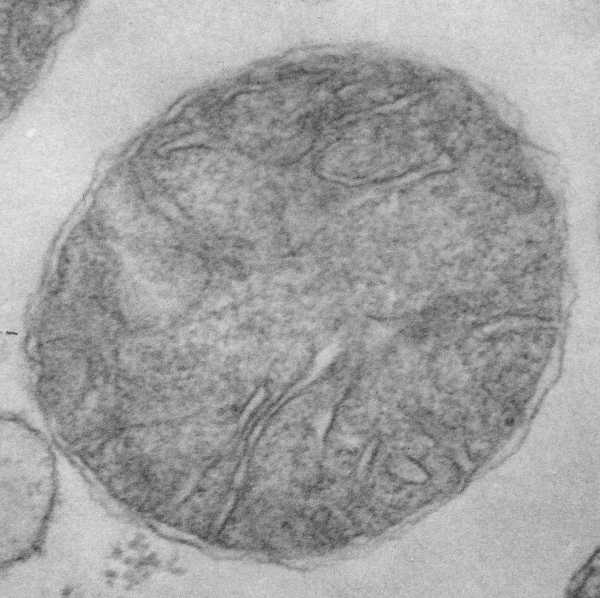
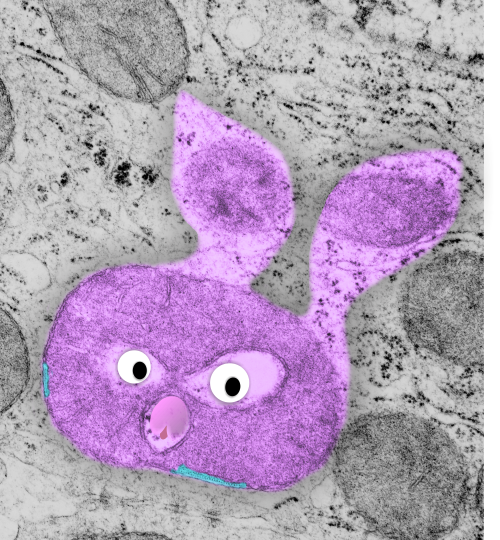
Here is an edit to fit the group and an electron micrograph. Ha ha… probably too big…I will have to google the size of the molecule relative to the 3-5 nm thickness of the trilaminar membrane. within the band of the mitochondrial membrane it is easy to see a change in aminoacids by the increase in grey coloring in that area. This model is by element, the amino acids in the central region are mostly isoleucine, leucine, proline, and phenylalanine which RCSB has colored with very close shades of grey, hence the slighly more grey look to the transmembrane part of this molecule.

And the ribbon molecule emphasizes the vertical order in the transmembrane band….  I know there isn’t really anyone out there who doesn’t already know this, but the visualization here really makes it so apparent. Sheep – entire respiratory chain complex 1 ribbon diagram from a different database. .
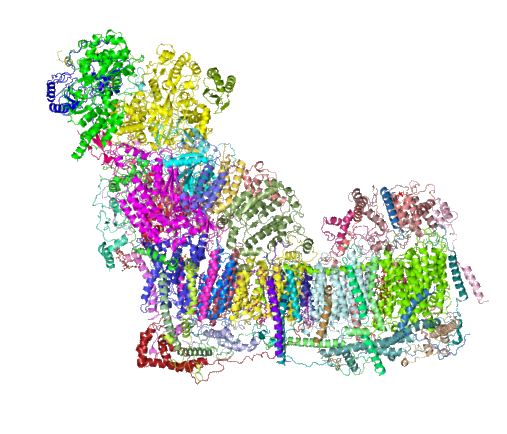
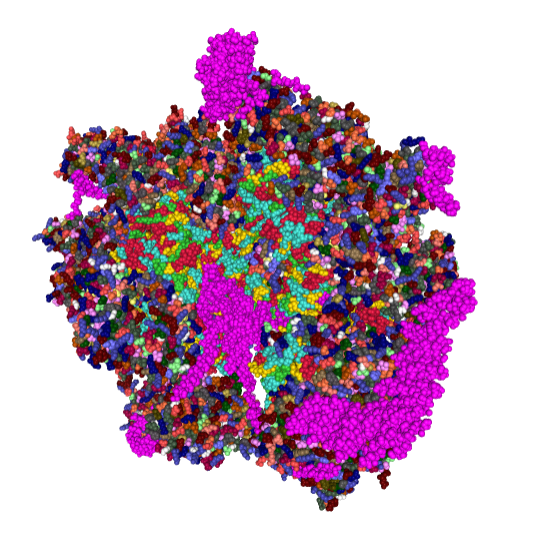
and Cryo-EM structure of human respiratory supercomplex I1III2IV1


Mitochondrial inclusion: matrix proteins?

Hunting for an answer to what might be the inclusions seen in mitochondria in my micrographs from Rhesus monkey liver I ran onto this awesome paracrystaline inclusion found in mitochondria in some myopathies. I have searched and really have not found a great micrograph, but several pretty nice ones, and am reproducing what looks like an oligomerization pattern to these inclusions.

1) they don’t appear to be formed in cristi but more in the matrix.
2) it seems like there is a limit to the pattern of oligomers – and a border
3) different micrographs show different orientations of the patterning

Cut and paste portions with reasonable resolution and partial diagram of patterns. It is not really clear from micrographs available that these are matrix or intracristi..but they do seem to have a bounding membrane. Top row of segments look like three layers: row 1 flat; row 2 staggered 45 degree end on, row 3 staggered flat.  Middle row looks much different with less than a 45 degree angle to the middle row, and a longer and shorter component, and for rows 1 and 3, a taper to the “bricks”.  Last picture on the bottom right… different again.

Mitochondrial inclusions

Liver from a rhesus monkey shows some mitochondrial inclusions.I found creatine kinase inclusions – paracrystaline but they appeared to be continuous with cristi membranes, SO MAYBE this (as found by someone else below) is not a perfect match but certainly a better match than a summary of the mtDNA mutations which are even more awesome than the paracrystaline inclusions in the monkey liver here. (anm# 97A mid lob, liver, control biopsy december 1974, negative 5743, block 4360, modified karnovsky’s, Epon 812 – to the best of my knowledge).

I havn’t included all the links, but ONE link i am adding which was an awesome summary of different paracrystaline and concentric cristi arrangements. FIND THAT ARTICLE LINK HERE. Mitochondrial inclusions, in general, would be a great topic for study, relating them to various over production of proteins, oligomerization, and loss of function.

Easter bunny mitochondria

Please forgive, LOL, as this little mitochondrion which is from guinea pig liver, just was staring out from the page. You might notice that there are some (blue) regular protein molecules near the bottom right and left.  These are likely to be ATPsynthase all aligned in perfect order — see previous post with similar structures from guinea pig hepatocyte mitochondria.

Bridge or intermediate filaments?

When I first looked at this micrograph i thought perhaps the electron density under the mitochondrion (here above two desmosomes, tangentially cut and off center, was a bundle of intermediate filaments. That would be interesting since i don’t know if filament bundles likely composed of keratins 5 and 14, could make this tethering bridge between desmoplakin –part of the desmosome in complex with two remote points on the mitochonrdion.

Turns out that It looks more like a little invagination along part of the plasmalemma of the mitcohondrion, probably representing outer mitochondrial membrane. Red dit=ribosome@27nm, blue curley bracket=bridge, red lines, intermediate filaments bottom red lines, underscoring position of thedesmosomes.

electron microscopy mitochondrion