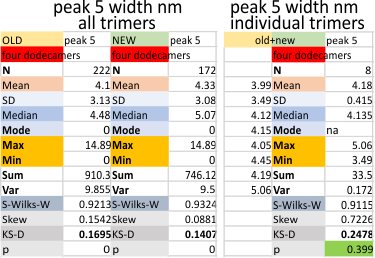
Peak 5 of the trimers of surfactant protein D is shown this post. The peak number is counted with the N termini junction peak as peak 1 and moving in a mirrored direction from that point toward the CRD peak. Peak 1 (N termini junction, well described, obvious and tallest); tiny peak (peak 2, not currently described, small, and between peak 1 and the alledged glycosylation peak); peak 3, the described glycosylation peak; peak 4 (lateral to the glycosylation peak, detected very frequently, large, and not as tall as the glycosylation peak); Peak 5, below, is not tall, and quite thin, but detected frequently enough to make it a likely event.
Category Archives: surfactant proteins A and D
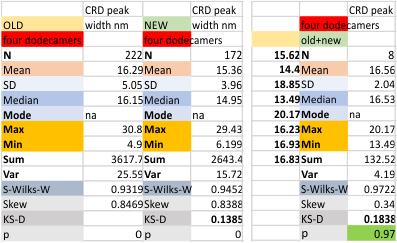
Four dodecamers: carbohydrate recognition domain peak width
Four dodecamers: carbohydrate recognition domain peak width of grayscale plots of hexamer of SP-D derived from AFM images from Arroyo et al.
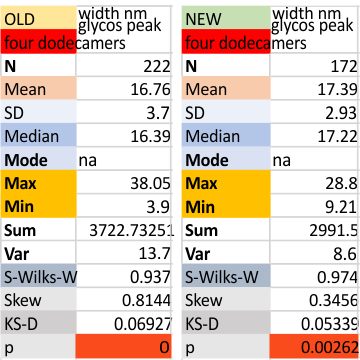
Four dodecamers: glycosylation peak width, old data and new data
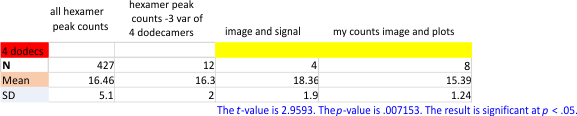
Two different datasets (gathered with the same process, but just different plots) look so similar that it seems likely that this 16nm value for the width of the glycosylation peak will be appropriate for the training plots to examine the other 80 dodecamers of SP-D for which i have pictures. 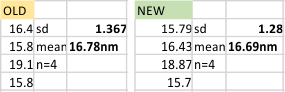 The valus for all plots together (not divided into the four dodecamers) for old and new datasets below. Please note that the red box at the bottom is an indication of deviation from a normal distribution of the dataset, this shows a significant skew which appears because of the variations in the way signal processing programs divide up the plot into peaks, and how I arrange the peaks into a number (15) that was determined by those same image and signal processing algorithms.
Four Dodecamers: tiny peak (peak 2, lateral to the N termini junction peak) of SP-D
Here are additional, and hopefully the last, set of numbers for Peak 2 (tiny peak beside the N term peak) of SP-D, in terms of peak width. I have used all numbers, including those which do not detect the peak, generated by plots of the trimers (as part of a plot for a hexamer, one CRD to the other CRD to determine that particular peak width. I personally think that adding the missing values is a bit nuts but here are the data, including a new set of numbers which indicates that the peak is a non normal distribution.
It is fair to say that the peak width (when measured only on the values present (please note that the number of actual counted peaks is in parenthesis by N) is N=4, x=3.75+/ 0.34nm, which is consistent with measurements from the beginning of this study. For one dodecamer (42a_aka_44 see below on right hand side) this tiny peak was detected in more than half of the trimers plotted).
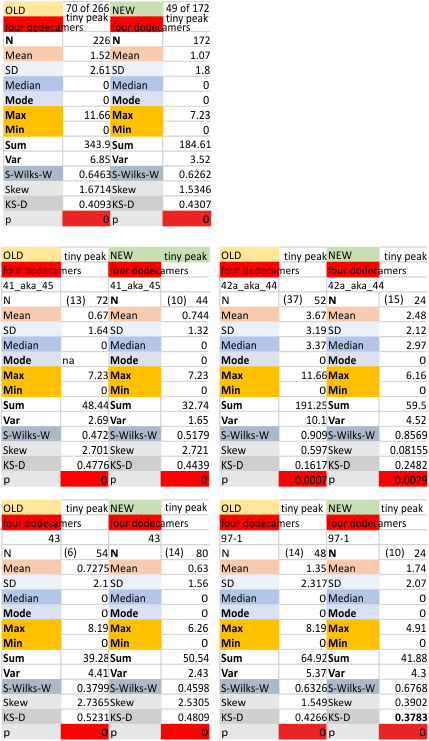
Four dodecamers of surfactant protein D, replicate tiny peak width (peak 2)
Four dodecamers of surfactant protein D, replicate tiny peak width (peak 2) which is a peak that shows up about 30% of the time. I have determined the peak width in nm in every which way i could, except combining the first (old) and second (new) datasets, which I chose not to do because there were some duplicates. The first dataset had every plot for every trimer that had been plotted up till that time. The second (new) dataset did not include the Gwyddion (red only in RGB) images, and so that left out all the limit range image filter images. The second dataset also did NOT include some of the far out filters in programs that were clearly not that usefor for determining structure. It is a select dataset that has a reasonable number of plots made mostly with images filtered with a gaussian blur, or median filter, and then peaks determined in 5 different signal processing programs (mentioned numerous times before, but including Octave (autofindpeaksplot, ipeak), Scipy, LagThresholdInfluence, and an excel template called PeakandValleyDetectionTemplate.
Note that the N termini junction appears twice (as there was no good way to divide the width of that peak in the trimers, as it represents a central combined value of a hexamer. Thus, a complete N term peak width is part of every trimer and appears as a complete peak each time. I am actually happy that the combined mean nm width for the tiny peak is about what I had hoped, that is, just around 3 nm. 30.1% is the occurrence from the first dataset 28% is the occurrence from the limited (second) dataset. The mean of 2.9nm +/ 1.8nm is a summar from data with missing values, without missing values, first and second datasets, and those two criteria applied to each of the four trial dodecamers (as trimers) individually. This works out to 16 separate tiny peak (peak 2) widths, for which the mean was found. Actual values are left hand column.
SEE NEXT entry for current numbers !!!
Four dodecamers of surfactant protein D, replicate N peak width
Four dodecamers of surfactant protein D, replicate N peak width.
Previoius values for the width of the center N termini junction of surfactant protein D dodecamers (from AFM images published by Arroyo et al), comprised a large dataset, hundreds of plots, four different dodecamers and the means for N termini peak width and all the other peaks (8 per trimer) were posted as well. In this new dataset, the Gwyddion processed images were not used because of the huge differences in grayscale values (Gwyddion exports as R, not RGB, and I assume that is the reason – at least I could not figure out how to export images processed in Gwyddion as RGB). Some plots were used in both datasets.
Also, the very far out image processing filters were eliminated, and the new set really is focused on 5 and 10 px gaussian blurs, very little else. ( i can make a list if someone would like it). Also, instead of hundreds of plots, there are many fewer, but very surprisingly the data from the big set of grayscale plots, and this abbreviated set are so close, that I think there is no reason to plot and process every image in all permutations and combinations of signal and image processing.
Comparisons are below…. listed as old and new, for the whole column – for the individual dodecamers (listed by name as 41_aka_45, 42a_aka_44, 43, and 97-1 — designations only for record keeping), and again, with an N of 4, using the N termini width for each dodecamer individually.
The n for the N termini peak width values duplicated…. a complete N width for each trimer, so the actual n is “half” that (see the (/2) notation on the excel images.


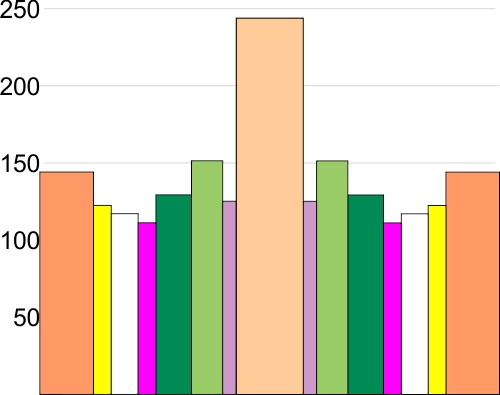
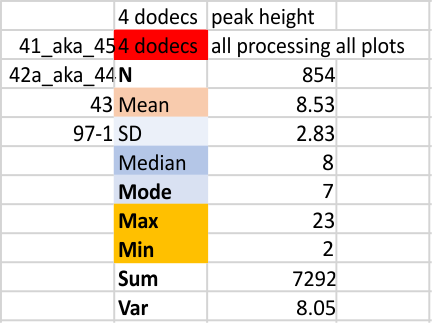
Four dodecamers of SP-D, summary of peak number, peak height and peak width for 300 hexamers
Here is a plot of the height and width (summary of 600 different plots of SP-D trimers)
I have sorted the plots by hand into the “mean number of peaks per hexamer that was found for this same dataset” So you see 15 peaks, you see the fifteen divided (mirror on either side of the N term peak (peach), tiny peak on the downslope of the N term (purple), peak =glycocylation peak (medium green), peak 4, unknown peak, large, and also wide (dark green), unknown small peak (peak 5, pink ), unknown low and broad peak 6, (white), and peak 7 likely the neck domain of the hexamer (yellow), and peak 8 the CRD (orange). This is the a mirror (n=300 plots) of the left and righ trimers (n=600). X axis is percent of width, Y axis is grayscale value 0-255.
The images exported from gwyddion were not included in this dataset because of the huge difference in the grayscale values for images exported R vs RGB when plotted in ImageJ).
Peaks within each of those peaks is shown here. The peaks which are not present all the time have a value less than 1, those with a value of more than one often have more than one peak as sorted above. List is for a trimer…. begin in the middle of the above graph, and move to the right (and mirror to the left from the N term peak). This means that a minimum, there are five consistent (not the published three) but five peaks found all the time. That is the widths… peak 1 (N terminal domain 26nm), peak 2, unknown peak (3nm), peak 3 (glycosylation peak 10 nm), peak 4 (undetermined function, 12nm), peak 5, undetermined function (4nm), peak 6 (undetermined function 7nm), peak 7 (likely the neck domain that sometimes is seen sometimes covered by the CRD (4nm) and peak 8 (carbohydrate recognition domain (12nm).However, I am doing more valley determinations to provide a “background” or “baseline” for the peaks which will likely NOT be a straight line and may give information on the “slope” of peaks.
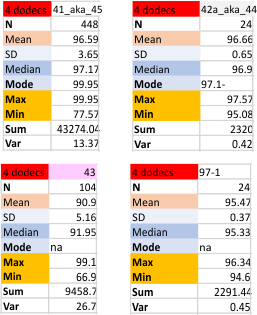
Four dodecamers of SP-D
Finding peak height with all the various image processing filters and signal processing algorithms has been time consuming. I think there is one filter which will always have to be analyzed initially separately. That is, the limit range filter that gwyddion uses, and that also occurs in other image processing programs (i used it just twice in GIMP). The peak height for the N term (center tall peak in each hexamer) is highly significantly reduced when the limit range is used. All other processing filters and algorithms seem to produce a relatively even group (when Y is normalized to a percent). Initial data of the comparison is below. You can see there is one value (max 101) which i need to find. There are no perfect datasets, but the shere number of plots represented here means finding it will do nothing to change the outcome.

Here are each of the four dodecamers (traced as two hexamers).

Four SP-D dodecamers: more plots use to determine trimer and hexamer peak numbers
Previously counted plots included all that were available at the time (found in this link; which had about equal numbers of plots from each dodecamer (hexamer – trimer). The data on this page show just about every plot that I have ever made….. these are divided as to trimer…. so this is mean trimer peak number. The latter counts the N term peak with each trimer (even though it is shared between all the trimers…. each trimer it gets counted once. Therefore a peak number of 8 per trimer would become peak number of 15 per hexamer owing to the N term peak being shared. In terms of progress…. its best to assume that the more recent posts are the better data. Every possible image and signal processing filters and algorithms are summed here. Some people counts, all counts…. this represents a huge N, in my estimation.
I think my current favorite image processing filter is still the gaussian blur, and my favorite peak counting program is PeakValleyDetectionTemplate.xlsx by Thomas O’Haver.
Peaks per hexamer were calculated four ways. As every plot made for each of these four dodecamers. This includes hundreds of counts for one dodecamer, and between 26 and 50 hexamer plots for the other three. Certainly one carries more weight, or one would think, but the data using each of the plots separately is not different than using each of the methodologies (at an absolute minimum there were 2 image processing filters, and at least 5 signal processing algorithms for several of these image processed pictures.
Data are also given with each of the four dodecamers individually: (41_ak45; 42a_aka_44; 43; 97-1). In addition. n, mean, sd, and other parameters were calculated from my original peak counts from just the “image”, as well as from my original peak counts from the plot generated in ImageJ. This is in addition to the whole lot of plots subjected to signal processing. Bottom line is that signal processing appears to increase the peak count in a significant way. Whether the signal processing is “better” (which i dont think it true” or counts from images is “better” remains to be sorted out. Below is a comparison of the various “sorting” that I used to determine mean number of peaks per hexamer of SP-D.
Two left columns are: 1) Every plot of a hexamer separately, 2) Plots divided into each of the four dodecamers separated into groups; Two right columns are counts separated into “image with signal processing” per dodecamer ( and separated again into, my counts of image processing plots only plus my counts of the peaks in plots made in ImageJ (that is… NO SIGNAL processing) 18+ peaks with signal processed plots, and 15+ peaks using my hand counts. 15 peaks per hexamer is in my bet for the best number. See previous posts here.
Comparing just the means of the four dodecamers I have plotted many times, there is still a large difference found between those images processed with a limit range by Gwyddion, and all others (lumped) processed by many many different image programs and filters. Someone else can investigate and suggest) whether this set of filters should be included anyhow. How many times the plots of images using gwyddion’s (or any) limit range filters should be included in the dataset or excluded…any choice I make will be arbitrary – and the change in the way ImageJ plots maybe inherent in the app… and not for me to figure out. Peak height in all Gwyddion processed images vs all other is shown below. 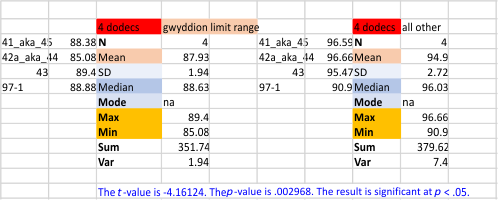
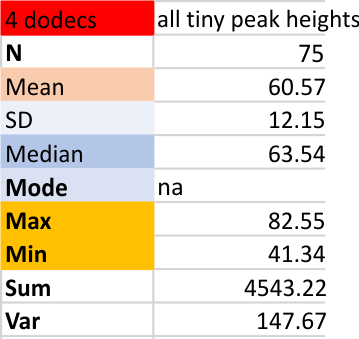
The smallest peak that I see, which is on the downslope of the largest peak (N termini junction peak in the center of the dodecamer) and is very often missed by the signal processing algorithms… thus not all signal processing programs identify all the time (75 times out of 200 plots). the “tiny peak (one occurs on both sides of the N termini peak) has a height “relative to the N term” shown below. The value of 60 is percent of 100 percent, where 1-100pc = 0-255 grayscale units. This small bright area along the arm of the molecule is NOT seen on all four arms of the dodecamer consistently, but it occurs at a frequency that made me take notice, and that i can identify often enough to consider it something to investigate. Summary below is taken from four dodecamers (16 trimers, 8 hexamers, four molecules) of SP-D. The signal processing here has been done on images to which a limit range filter was applied in Gwyddion and the four SP-D molecules were not separated, the N of 75 represents just those where signal processing found peaks out of 200 plots.
Getting closer to making a “concensus SP-D LUT plot” from which to build an AI model
Getting closer to making a “concensus SP-D LUT plot” from which to build an AI model.
I had four SP-D dodecamers to work with, literally hundreds of plots, 5 different plot peak finding algorithms (apps, programs, websites), and a dozen different image processing programs, all to find the perfect peak plot for SP-D hexamers. These molecules are bilaterally symmetrical (three identical x three identical) with the N term junction in the center. Little is known about the central connections though the CRD and neck regions have molecular models. Taken about 3 years to try to figure this out, input would have been (would still be) very valuable.
I am hopeful that an easy technique will be the outcome, that is an easy technique for assessing peaks in many different types of molecules (images from AFM at this point), particularly those which are bilaterally symmetrical.