Monthly Archives: January 2020

Maybe this is sufficient?

After many tries, and after mainly two, but total three publications with AFM images of SP-D, some with micron markers, some with wrong micron markers, even so included, and using two methods for determining the length of hexamer arms (two trimers N terminus to N terminus) (using lines that cusp and a diameter that contacts 3 of the 4 CRD) here is an image which shows the process, a sample from each author (with variations), and the mean for quite a few measurements.

Count, N: 186
Sum, Σx: 27251.636
Mean, μ: 146.5 σ: 22.1
Variance, σ2: 491.33

Groan — tared and torn

my pitiful joke to a cashier at whole foods…. who totally didn’t get it…

BACKGROUND: if one takes bags into whole foods one can get them to “tare” them… with black marker on the bag it will say “0.07 lbs or something appropriate for the weight of the bag…. that way one doesn’t have to dump out all the potatoes from the bag have them weight them and put them back in the bag… etc etc… for apples, and stuff…

so one of my tared bags tore, and i didn’t want the guy to pick up the torn bag and dump everything out all over the floor…. so i said this bag is “tared and torn” he just looked at me like i lost my last marble….. i thought it was funny pun… he did not….. the jury is out

SP-D, more stuff

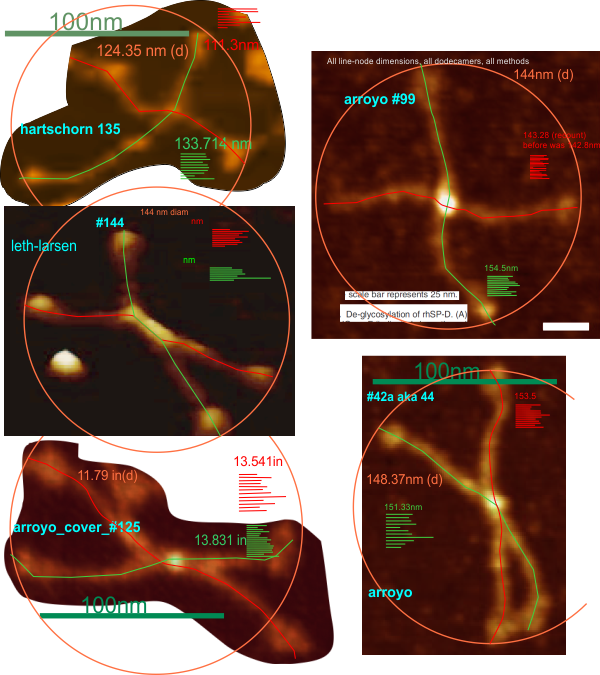
60 SP-D dodecamers from three publications, two authors and a cover image have been measured to find an “arm length” for the separate arms of each molecule, that is, one measurement for two trimers N termini attached, two of these per molecule, again that is from one CRD to the opposite CRD is one set of trimers, and there are two of these per dodecamer which have been measured with a line which has nodes (cusps) and therefore represents a “straightened” length, not just a “crow fly” length.  120 measures from those 60 molecules.

Another set of measures, also totaling 60, was obtained by using a diameter from a circle which touches at least 3 of the four CRD. These two types of measures are not statistically different… however it is close, the linear measures of arm lengths being just a little greater than the diameter.

Arroyo et al images have been used from their Fig 1, Fig 3, Fig 6a, and from their cover (wherein lies the greatest source of variability in size since I believe the mentioned micron dimensions are in error.  Additionally, there are small variations in the general size of SP-D dodecamers from Figure to Figure.  ONE molecule is de-glycosylated so there are two arms measured with the line which cusps to accommodate the curvature of the arms, which was very close to the mean anyway, thus included in the analysis.

Images (albeit not as nice as those from the Arroyo et al paper) from the paper by Hartschorn et al were measured as well and that mean was smaller (18nm) than the overall mean (of the 120 arms and the diameter measurements)  while the  cover images of Arroyo et al were about 25nm larger than the mean.

N1: 120
df1 = N – 1 = 120 – 1 = 119
M1: 148.4
SS1: 63382.63
s21 = SS1/(N – 1) = 63382.63/(120-1) = 532.63

Treatment 2

N2: 60
df2 = N – 1 = 60 – 1 = 59
M2: 143.05
SS2: 26472.99
s22 = SS2/(N – 1) = 26472.99/(60-1) = 448.69

T-value Calculation

s2p = ((df1/(df1 + df2)) * s21) + ((df2/(df2 + df2)) * s22) = ((119/178) * 532.63) + ((59/178) * 448.69) = 504.81

s2M1 = s2p/N1 = 504.81/120 = 4.21
s2M2 = s2p/N2 = 504.81/60 = 8.41

t = (M1 – M2)/√(s2M1 + s2M2) = 5.35/√12.62 = 1.5

The two tailed t-value is 1.5047. The p-value is .134173. The result is not significant at p < .05

Significant difference in size one figure to the next

Accurate micron markers are difficult.

After measuring over 40 SP-D molecules from two different figures, actually measuring each molecule three times (once as diameter touching three of the four dodecamer CRD, and once as the corrected liner dimension of each of the two arms CRD to CRD) using the provided micron marker…. these are different “The t-value is 5.73389. The p-value is < .00001. The result is significant at p < .05." I didn't even bother comparing the cover images which are grossly bigger than the molecules in these two figures. THIS IS WHY THE SIZE must be given a reasonable and standard size for each trimer.... Othewise peak height obtained with LUT plots, and positions (and even peak number) cannot be measured. Official difference between the cover dodecamers (arroyo et al) and the mean of all those dodecamers found in figures 1, 3 and 6 is considerable. One needs to reduce the cover dodecamers by 80.70%. Even though the difference between dodecamers in figures 1 and 6 is significantly different.... these were not adjusted one to the other since it was not possible to tell which was most accurate.