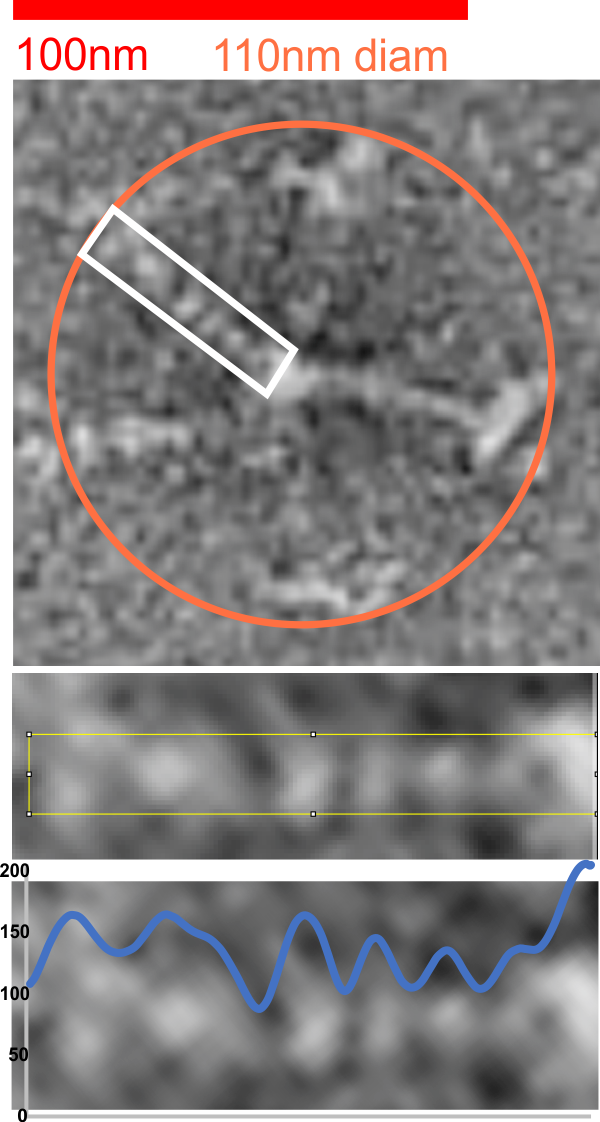
RhSP-D negatively stained and pictured in a publication by Perino et al I have used to map using LUT the peaks along the collagen like domain. There are now three techniques which provide info on the possible configuration of that portion of the molecule. The peak smoothness, low noise, and visual appearance make the LUT plots resulting at least as informative as AFM images.
red bar marker is that size provided in the original figure (Perino et al, Fig 4b, central multimer from the middle panel. The image was resampled in photoshop to 700ppi, but no changes in contrast were made. The image was rotated and the arm within the white box, cropped and exported to tiff and opened in ImageJ2 (FIJI). The image below this shows that area plotted (half of the 110 nm diameter found for the whole multimerm) going to the center of the Ntermini junction with the other arms (in this case on the right hand side of the image). Plot is in blue, the left side two peaks are the CRD (often showing a valley where the CRD are just beside or adjacent or overlapping each other), a little slow slope which would most likely be the neck, then moving to the right, 3 very obvious peaks, a lesser obvious peak and the Nterminus peak. The only problem here is that the 3 peaks in the collagen like domain usually are reversed in height, the highest peak being nearest the Nterminus…. so thats a little bit of a problem.
Of the images of SP-D whether trimers or dodecamers or multimers and whether prepared by different researchers by different methods, human SP-D appears to have 6 peaks along its trimer – first and last peaks being the Nterminus and CRD, second peak next to the former is the next highest and is possibly the glycosylation site occurring in the collagen-like sequence, peaks three and four are smaller and sometimes 5 which might be the neck domain is lateral to the former. All those are easily seen on AFM images, can be seen as well on rotary shadowed images. Here is a LUT plot from an image by Perino et al which is the third technique, that is negative staining. IT comes to mind that negative staining might be an interesting place to see these peaks, as the background noise, while greater than AFM – which smoothes over the peaks, minimizing them, is less than rotary shadowing, which has a background noise which is sufficient to mask some of the peaks. Thus the latter is probably more apt to show detail than either of the other methods.
So AFM, TEM of rotary shadowed SP-D molecules, and also negative staining show evidence of 5 (give or take) total greyscale peaks per trimer. What would have been nice is to have had a dark “hole” in the center (collection of Ntemini) of this multimer.
Both methodologies show SP-D dodecamers to have similar LUT plots – and while there are differing numbers of peaks between the N terminus and the CRD, it is more likely that 3 peaks between them is most common. It is a little problematic to use rotary shadowed images to plot LUT peaks because of the background noise from the shadowing process. AFM does not have that problem. However shadowing molecules also depends upon the “peaks and valleys” of the molecules as they lie on the surface so it is not entirely without validity to at least examine the LUT peaks.
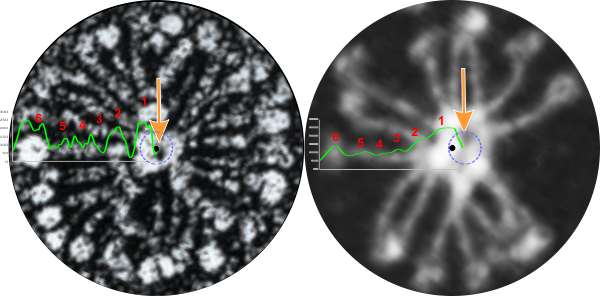
Two multimers (one from E. Crouch which reports the image from which i cropped the SP-D multimer is originally from Heuser and the other from Arroyo et al) show multimers with a central low height area. The peaks that radiate out from that central dark area mean to me that the N termini are not bound end to end but maybe side to side (as they are in SP-A, and other “bouquet” arranged collectins. Comments are welcome.
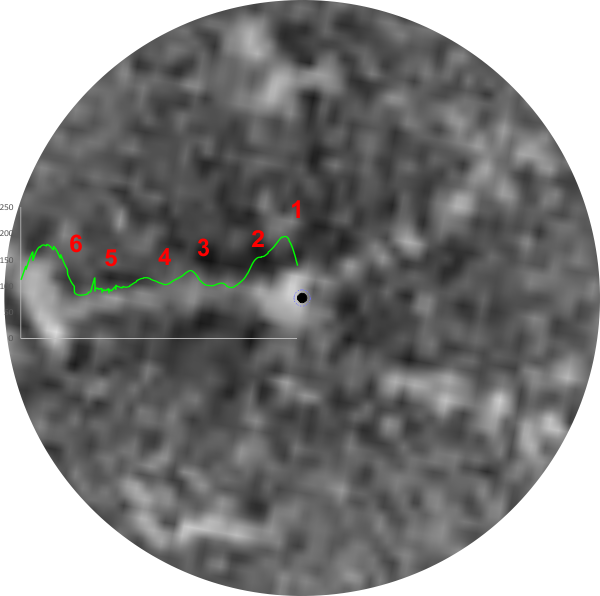
Tiny black dots in the center of each image represent the geometric center, dotted circles are more inline with the dark area which might be a space central to side-to side N termini, the green lines are LUT plots (ImageJ2), red numbers signify the peaks as follows: 1=Nterminus, 2=peak where the glycosylation site which was shown by Arroyo et al, peaks 3, 4, and sometimes 5=as yet unreported peaks which are very consistent in position, width and height, and 6=CRD. Right hand is Arroyo et al’s AFM (with an odd number of arms – 15?) which did have a micron bar marker, and left is Crouch’s image attributed in her paper to J. Heuser (ostensibly 30 arms) which did not have a magnification marker.
Sir Ernest Alfred Thompson Wallis Budge (27 July 1857 – 23 November 1934)(wikipedia) was commenting on Oedipus Aegyptiacus, Athanasius Kircher’s supreme work of Egyptology, with this biting remark – “but as they were put forth in a learned tongue many people at the time believed they were correct” This brings to mind all the “fake news” and “fake science” and “fake reporting” that we consumers have to deal with every single day.
All this comes up as I found a really wonderful little image which I am turning into a stained glass mandala pattern.
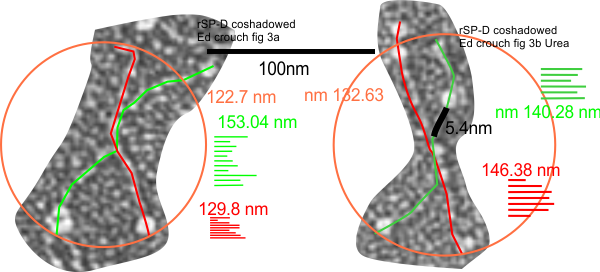
Measurements on rSP-D size, two treatments in a publication by Ed Crouch et al, JBC, 1994 where they state “Electron microscopy of freeze-dried preparations demonstrated a highly homogeneous population of molecules with four identical rod like arms (46 nm in length), each with an 8-9-nm diameter globular terminal expansion”. (to add coiled coil neck – italics mine)
Their measurement of arm length seems just a little short to me since there is no bar marker in their micrographs, using their bar marker to check is not possible. I used the width of the collagen molecule- coshadowed – to determine the magnification and two methods of measuring the arm length (diameter touching three CRD domains, and vector-node lines (obviating the need for finding the curvature of the arms)) which puts the size of their rSP-D molecules at about 135.5nm + 7nm (n=41, that i found, using excerpts from their Figures 3a and 3b). Their assessment of 46+9=45 x2 is considerably less than 100nm thus creating a discrepancy that cannot be accounted for by adding the nm of the N termini peak to their estimates. Overall, using the collagen shadowing width does put their image right in line with other SP-D (human and rat) molecules in terms of overall size. No difference in measurements appeared to be present between molecules treated with urea and those not.
Image below samples how I measured the rSP-D
Than any man can get up in front of tens of millions of people (maybe billions) and claim its “his” doings that have caused the current economy to be good, the unemployment numbers to be low in the USA, has no real grasp of reality, or the hard work of the american workforce. That is just his ego talking. This man (Trump) really isn’t mentally fit to be president.
Trying to figure out the magnification of micrographs with no bar marker is a major pain in the neck. Trying to compensate, adjust, decipher and trust bar markers when they are actually present is hard enough, but when the don’t exist at all (typical get-around is the phrase “original magnification 177,000 or something like that which is absolutely useless in terms of measurements) it is even more difficult. Case in point, trying to figure out the size of the SP-D molecules, and those coshadowed with collagen, in a paper by Crouch et al. JBC, 1994.
To see whether i could find rotary shadowed type I collagen to compare their micrographs with i did find one image with a bar marker (who knows if that is accurate?) and found the collagen to have a diameter of about 5.4nm. This is pretty close to the limits of measuring anything with traditional TEM especially when the grains of the shadow material are almost that large. But regardless, I am going to use 5.2 as a collagen (and collagen like domain) measure to see if the images of rotary shadowed SP-D from Crouch et al will be similar to other preparations. (the leads to the comment — for whom are the publications really made…. for knowledge and as a resource, or just for building CVs of great length).
If the 5.2nm (or close… 5.3 or 5.4nm ) width for collagen type I measurement is applied to figure 3 of Crouch et al JBC, 1994, then a measured SP-D dodecamer (picked because it was clear and easy to draw a circle around that touched three CRDs) the molecule came out at about 136 nm which was better than i had hoped.
