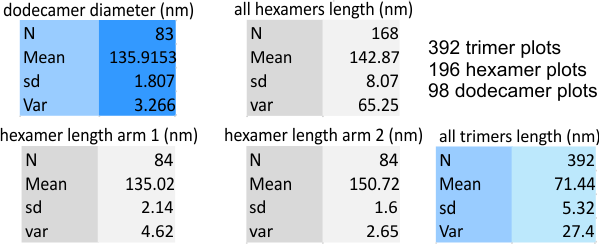
Summary of 392 plots from different signal and image processing algorithms of one (YES JUST ONE so far) SP-D dodecamer image, maybe a long and repetitive approach, but ultimately it may say something about which signal and imaging functions and filters get the most valuable structure data from an image of a molecule. The reason for using SP-D was the host of wonderful images available in the published literature (Arroyo et al) and because the current molecular model of SP-D is unfinished. Numerous models have been made of the carbohydrate recognition domain, but little else has surfaced.
I saw a need to compare the benefits of image vs signal processing to determine such things as peak width, height, and peak number in the arms of SP-D dodecamers to find the most informative, and easiest way to determine what the rest of the molecular landscape of SP-D might look like.
The image below was selected deliberately. It has features that are common to AFM images of SP-D, it had definite bilateral organization (in this case it is better called radial symmetry since the N termini are a central very bright peak and the arms extend to the CRD of each trimer. The labels on the image are guides to the values (N, mean, sd and var). 392 different plots were obtained from trimers in this image which were processed in a dozen different filters and algorithms with different programs and to many different degrees. You have seen this image many times before in this blog – i call the molecule 41 aka 45…. no surprises.
Some data here which can be explained by the labels in the image above: arm 1 is nearly horizontal, while arm 2 moves to a more vertical position from left to right. N termini – center black dotted ring, arrows indicate the directions of the plots. The whole N terminus is included at the beginning of each trimer plot. The trimers 1 and 2 are subdivided into 1a (left side of the micrograph) and 1b (right side), and 2a (again, the left) and 2b the more vertical arm on the right. bar marker=100nm. the diameter is shown by a blue dotted line and the criteria were that the circle had to graze three of the four CRD, in this case, left, right and top were used to calculate the approximate diameter of the dodecamer (the N here includes that many measurements using various processing and filtering of the image above.

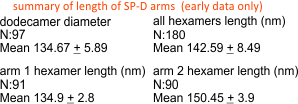
A comparison to a single imaging program and plots of this molecule are just very similar to the data from the bigger dataset above, see those values here.
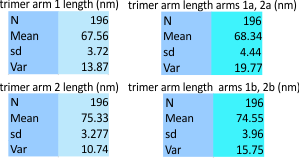
 More measures below on this dataset. Thesse are values from a single image. It is clear that there are some filters and algorithms that are more informative than others.


