Four SP-D molecules: glycosylation site peaks within peak

Using just four SP-D molecules, with arms plotted as hexamers, and recorded as trimers (reversing the mirror symmetry and using the N term value as the whole N term peak width), the glycosylation peak (now called the 3rd set of peak(s) in the trimer) sometimes has a lumpy appearance, and signal processing programs routinely divide that single (sort of) largest of peaks (second to the N term and the CRD peaks) into separate adjacent but clearly contiguous peaks, sometimes as many as 6.  When i see the brightness areas i dont often agree on what the signal processing programs call “separate” peaks as they really come together in one single significant elevation, clumped as separate but connected peaks.  The number of separate peaks within what is typically pointed out as the glycosylation peak in AFM micrographs actually has more than one peak… these data sort out using 4 dodecamers (16 trimer plots – assessed by 5 signal processing programs, several imaging processing filters, and one unprocessed image collectively) that about 2 peaks show up in the glycosylation “bright” spot.   1.92+0.204.  This will likely change with the addition of more molecules added to the set.

Four SP-D molecules: glycosylation site peak width

Below are the numbers for peak width for the glycosylation peak. The characteristics of peak, that is whether it is a single simple peak or a peak with multiple elements,  I dont find good mention of in the literature.

It is worth noting that because there presumably are three sites (one per strand of the trimer) which are potentially glycosylated, and whether there could be a bumpiness to the bright areas in an image representing the glycosylation peak. This might reflect structural features of “image” the three single strands if they are or are not glycosylated while wound in to a trimer thus causing a displacement of glycosylation sites perhaps showing up as peaks within the glycosylation peak (envision three beads on three separate cords, wound tightly, each displaced slightly creating a lumpy look.  This is completely different than the images which show the large CRD and neck elements which do show large bright areas quite distinctly separated at either end of the hexamer.  see CRD peak appearance with AFM images, left, and possible completely glycosylated trimer on right (NOT TO SIZE).


In most micrographs there is a dominant “bright” region which has been identified as the glycosylation peak in numerous publications, including the one by Arryoy et al which i rely upon heavily) as a single peak. Close visual examination reveals a couple of things, 1) it is a peak of varying width, and 2) sometimes it is possible to see small sub peaks within the whole. Signal processing and peak counts from images before and/or with the application of image filters, it is common to see bright spots within what might be considered a single larger bright region (brightness in this context is higher on the gray scale value y axis than lower). Defining the “modest but colvincing ” number for peaks along a trimer has been the focus of this research. Both total relative peak heights and valley to valley widths (not taking into account slope or mid peak areas) have yet to be determined for a hexamer of SP-D.

So using just a half dozen analysis protocols on FOUR (4) SP-D dodecamers (16 trimers – where the entire N term peak is included in each trimer), the first three peaks (beginning at the whole N termini junction peak) looks like this. N=19.86nm+1.46, tiny peak=2.53+0.74, glycosylation peak width=8.4+0.69.

My tendency was/is to see the AFM images of this molecule as having 15 peaks. Two pominent CRD peaks at either end of the hexamer, one peak (possibly with its own central valley (so moving the odd number of peaks to an even 16) in the middle and two recognized peaks either side of the N term. These peaks are numbered in many of these blog posts as Peak 1=N term, two tiny peaks on either side of 1, mirrored as peaks=2, then the two glycosylation peaks =3 (either side and lateral to the tiny peaks and sometimes clustered peaks.  Peaks which follow I am now suggesting are “real events along the collagen like domain”  as peak 4,  moderate size, fairly wide peaks, next very narrow low peaks=5, broad low peaks=6, and sometimes visible peak which appears to be the coiled coiled neck domain where sometimes it is covered by the CRD, sometimes not=7, at the end, the CRD peaks which are very prominent sometimes exhitibing clustered peaks=8. These I have colored with specific colors through out the peak counting process, as my own assessment of which of these categories the signal processing peak programs miss the mark (which sometimes they do, sometimes they dont).

Not all trimers show all peaks, thus the attempt to find a mean width, peak height and humber amont the dozens of AFM images I have collected.

Here is a link to description of the ridge plot (Joy plot) shown below.

Four surfactant protein D dodecamers: N termini peak widths

Summary of peak widths (valley to valley) using image processing as well as five signal processing programs to calculate that dimension. In one sense the results are really good, in another sense they are basically so similar to those just done by “my minds eye and a good measuring stick” that the two years has provided no new information.  20 nm is a very stable number for the valley to valley measurement of the N termini junction of surfactant protein D as is shown in AFM image.   This value is found as all trimers with the full N term peak, as for each of the individual molecules that have been measured (in this case my numbers for them are arbitrary: 41_aka_45; 42a_aka_44; 43; and 97-1) and also the mean of the four dodecamers (N=4) . The number of  trimers measured in one molecule was greater than the other three  so this data set was primarily made only those plots which have similar processing.  That is with 1: images with no processing, 2: images with a gaussian blur (either 5 or 10px); images that have a gaussian blur and a limitrange filter. 3: each of those images from each of those groups of image processing were then exposed to signal processing by five different algorithms (as part of several programs: Octave (Autofindpeaks.m, and iPeak.m; Scipy; LagThresholdInfluence (batch processing) and an excel template for Peakand ValleyDetectionTemplate.xlsx). Therefore the balance of bias was similar among the four images of SP-D.

The tiny peaks on either side near the valley of the N term peak are located by image and by a combination of image and signal processing algorithms only about 31% of the time. This is a little disappointing, but hand counting the peaks provides a more robust counting of those tiny but very consistently found peaks.

The number of peaks WITHIN the N term peak varies from 1-2 typically. About 50% of the N term peaks consist of two identifiable sub-peaks. The widths of the sub-peaks is not always equal and depends upon how the segmented line is drawn through the image.

Width of the peaks is about 3nm wide, which still can be identified within the micrographs very often. In this set there is one value which is large, skewing the data.
I calculated that single image without the large value below.

Here is the information (peak width in nm of the tiny peak) from months and months ago, which literally has not changed with the addition of the signal processing assessments.  I dont know whether to be happy this didn’t change, or be miffed because of the amount of time to confirm that the original assessment was pretty good.  Tiny peaks appear about 30% of the time (rather are measured as “peaks” by the five signal processing and one image processing plots about 30% of the time. There are many times that tiny peaks are visible, just are not counted.
)

Four surfactant protein D dodecamers: trimer length in nm

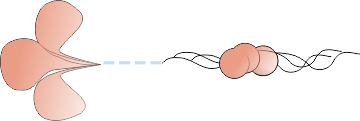
The length of a trimer was determined  from the center of the N termini junction peak to the edge of the carbohydrate domain (since this is a lumpy molecule…. the most central route for the line (plot) through the CRD was used. Many examples of the type of line are given in previous posts.

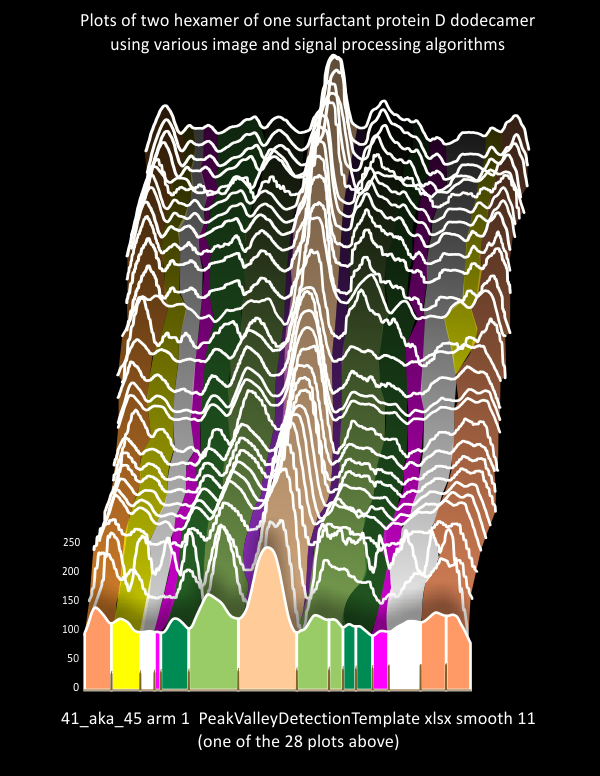
Applications were AS BEFORE- No processing,  gaussian blur (5 or 10px) and gaussian blur with limitrange (100 (or above)-255), and each is then subjected to all of the following signal processing applications for peak detection: Lag 5, Threshold 1,  Influence 0.05 (batch process), Scipy (Prominence 2, Distance 30, Width 5, Threshold -, Height -), Octave, autofindpeaksplotx,y and iPeaksM80, and excel template PVDTxlsx smooth 11.  This means that there are two hexamers (four trimers) each with no processing, some processing, and each of the latter subjected to 5 different signal processing routines.  Some select other processing can be included.

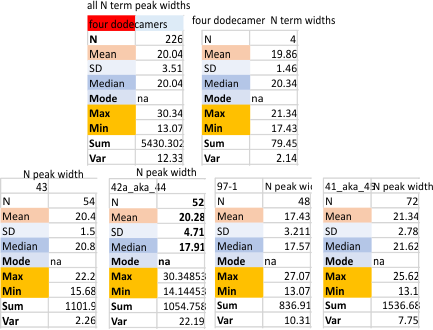
Trimer widths in nm, as all lumped values, individual values, and as a single group of four.

The number of peaks per trimer is calculated with all independent measures, as molecule measures (that would be each trimer of four individual SP-D images). The N term peak is calculated in full, WITH each N term peak that is not divided into two peaks. So adding up the peak number — keep in mind that N is counted twice if it is a single large peak.

Previously, using dozens of image and signal processing programs for literally hundreds of plots, of a single SP-D image (41_aka_45), the number of peaks per trimer was 8. Check out the post here. It is very encouraging to have a selected set of image and signal processing programs provide almost identical results to that original single molecule dataset. That means to me that the gaussian blur and limit range imaging filters can be used somewhat confidently to provide easier counting of peaks along an arm of a hexamer (or trimer) of SP-D.

Just analyzing the left hand side of each of the four images, the trimer length in nm is different (as relates most likely to preparation artifact, in stretching or folding of the arms.

just the righ hand side of the image (the second trimer in the hexamers to be traced are as follows.

There are so many ways to sum these arms up i just decided to do them separately as 16 trimers comprising 4 dodecamers.  It makes little difference that i can detect and a nice conservative number of 145 nm as the usual hexamer length, and  73 for the usual trimer length (not exact yes… ). but counting more molecules might be more efficacious than deliberating on just four.

Two conclusions. 1)  Image processing is helpful, signal processing to count peaks, not so much.  The plots smoothed with the gaussian blur and enhanced with the limit range function are easy enough to manually count peaks, and the peaks counted manually are guided by ones knowledge which the current algorighms are not (as in not recognizing symmetry, and not permitting small peaks to follow big ones. etc).  When a few more molecules are counted and added to the list then perhaps I will find someone who knows how to “train” peak counting algorighms.  LOL.

2) The number of peaks per hexamer is likely to be between 13 and 15. THis is much greater than that proposed by Arroyo et al, who found 5.


Four surfactant protein D dodecamers: comparisons: peaks per hexamer

Four dodecamers of SP-D, plotted in ImageJ, with and without gaussian blur, limit range image processing, and processed again with signal processing algorithms to determine peaks per hexamer.
Applications were – No processing or gaussian blur (5 or 10px) and gaussian blur with limitrange (100 (or above)-255), and each is then subjected to all of the following signal processing applications for peak detection: Lag 5, Threshold 1,  Influence 0.05 (batch process), Scipy (Prominence 2, Distance 30, Width 5, Threshold -, Height -), Octave, autofindpeaksplotx,y and iPeaksM80, and excel template PVDTxlsx smooth 11.
Four dodecamers were included in this set of numbers below…. analyzed as a total input, and as an N of four. Not a big difference.  This number is not too far off the extensive search for peaks in just ONE dodecamer (which was chosen for its microscopic appearance), where the peak number per hexamer was about 15,

Verge of a Dream: without a promise

There is a pearly glow
On the fender fin.
You say you will fall in
love with me,
I wonder
when.
I think the equinox
is neither there or here.
You might wish to be
alone or
alone with me,
it’s never sure.

In a velvet
theatre,
I wonder as
the actors kiss
then part
if they look
into the dark
for two,
new in love,
and wish for
that too,
in their hearts.

Then you in
the gray screen
lifted from
time.
A ring or
me that wind
about your finger
which one it is
I don’t seem to mind.
Held, as I am
like
the rock, bearing
the sword until
you ride
a curve in space
to another whose
hope for your
true love,
ends in
place
he’ll find was
without
a promise

RLB (posted 07/01/2022)

Verge of a Dream: I do not know —

I do not know the difference
Between one day and
Someday or if there is none.
I do know
it is when
all
consequences
will finally end,

I do not know the difference
Between acceptance and
love or if there is one.
Though
the gate may
close behind me
at eleven fifty nine
I do know
To take it and
Not to turn
It
down.

I did not know the difference
Between whats been true
And whats been waste
Though its clear
As a few years now
Have passed
That it will speed
Before me when
Neither it nor I
Will last.

RLB (posted 07/01/2022)

Roe v Wade: unfair distribution of burden

While i agree that the constitution does not have the right to provide the “right” to abortion, and while i do not think abortion is an appropriate form of contraception, pregnancy happens.

In my own case, the male (whom i married), was arrogant, impulsive, unwilling to change life style; I was weak, and wimpy and did what he asked.  I am not the only woman who has been, or will be in this situation. In truth, all i needed was for that male to say “awesome” i am going to be a father and there would never have been an abortion.  How ignorant are we all still of the differences in gender psyche… good grief.  How few men step up to the plate and become parents, fathers? Not that many.  …. And thus result of the act which required equal voluntary participation from man and woman, was left on my shoulders entirely  (not just once, but 5 times, for three children).  Some women need protection, I don’t need it now, but i did then.  I hope women are given that help. I hope men are included in any punishment or legal action. Where is the equity in this.

Since we see the burden of pregnancy and child rearing weighing most heavily on the woman…. the few males engaged in an equal burden. But they were gung-ho during sex.  How is it that they will be so little affected by this overturn of Roe v Wade, yet in cases of incest, rape they are the perps.  In cases where there are genetic defects where fetuses are not going to be viable at birth, who would force pregnancy and delivery on someone to watch a newborn die.

I am not for abortion at any time, BUT sometimes it is the better path. What that path is can be misued, ues, but I am for laying responsibility most directly on the shoulders where it should lie. I am for equal work and monetary investment for men, and women in child rearing…. that hasn’t happened. Make no mistake, this is a gender issue. Women are still the individuals who carry 99% of the burden of children, even in 2022, women of all races and creeds and nationalities and faiths bear that.  So we have lots of men, also every race creed and nationality who accept no physical burden, financial or emotional burden for child rearing.  How totally sad.

We best be voting out of office those who restrict personal medical rights, and condone forcing women to singly carry the responsibility for what is a shared burden at best, and forced burden at worst.

Econimically and socially, this is going to “be a snaffoo for lot of old white men”, ha ha.  watch the change in birth rate among poorer and darker skin people. Watch the cost of gov. substidized health care…. I hope that it comes right out of the pockets of the well off white men of considerable age.  That is what i hope.

BIAS vs LEARNING: am I rejecting valid “learned” input

No surprise here — except that it was a surprise, a little bit anyway, that as I add more and more peak finding algorithms to the bank of data on surfactant protein D, and understand that the input values for those algorithms are “human” intuitions (knowledge), then it is no surprise that as I find peaks just by visually scanning a grayscale plot of SP-D that I can hear my thoughts… 1) what is the relationship between the peak I am examining and the peaks along the entire molecule; 2) what is the relationship between the width of the peak and the entire plot, 3) height of the peaks that i consider noise.  I have never considered myself to have any knowledge of algorighms… i have no interest in math or equations or programming, but thats actually what I do when I examine a plot and pick my own “peaks”.

For me it was an interesting revelation.  I value my input now more than I did previously as the whole search for signal processing programs to analyze SP-D grayscale peaks was because somehow I felt that my peak choices were not “scientific” (and of course if i submit a manuscript, you would have felt that my peak choices were not “scientific” either, as you review the submission.  In fact however, the “ai” in my mind, is superior to any of the peak finding programs (for this very narrow, and specific peak finding task (as i would not suggest that in some of the noisy data from other applications i could even begin to find peaks……. but specifically in this data, where there are a reasonable number, say something around 10-20 peaks, my input is considerably more sensible than the algorithms I have found optimal in Octave, excel template (PVDT), scipy, and LTI… just saying…  LOL, why should i reject my own observations and accept ignorant input.

Yes I introduce BIAS in my peak finding, i call it LEARNING HERE. Ultimately I will compare the data from my peak counts, to those algorithms.

I see the comments that say  “you have to “fine tune” these algorithms”…. thats what the cortex does, fine tune.  Signal processing provides as much opportunity for introducing learned BIAS as image processing, the whole thing gets reduced to integrity of research, sample number and common sense.

I am NOT talking about really noisy data, ….  where casual inspection would be nearly useless.