Category Archives: Ultimate order, the cell

The beauty and order of life is astounding.

Looking back at Gclc wc/ii mouse mitochondria

Quoting from Chen, et al, “Hepatocyte-specific Gclc Deletion Leads to Rapid Onset of Steatosis with Mitochondrial Injury and Liver Failure” ……a gene essential for GSH synthesis was disrupted by engineerig the albumin-cyclization recombination (Alb-Cre) transgene to disrupt the Gclc gene specifically in hepatocytes and deletion
within the Gclc gene was mostly complete at postnatal day 14, and GCLC protein nearly depleted at postnatal day 21. GSH depleted in weeks 2 – 3.

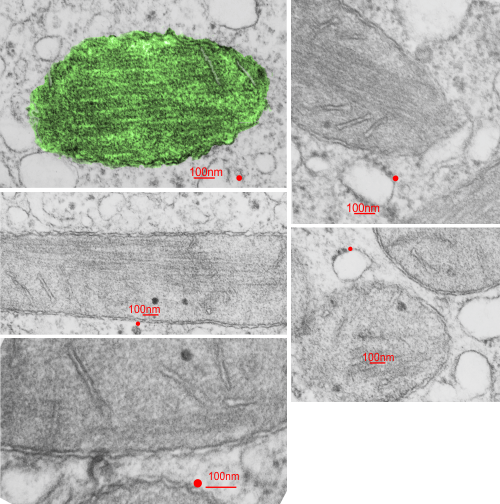
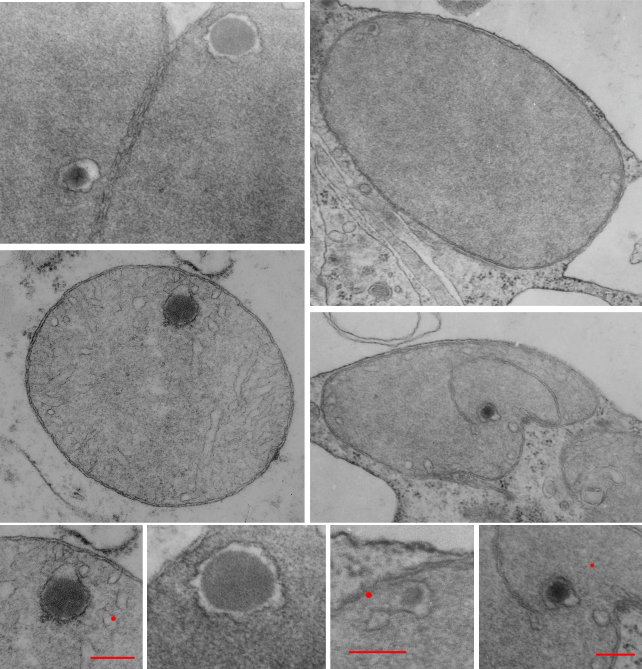
Mitochondrial loss of GSH was less severe than cytoplsmic loss but ultrastructural changes in mitochondrial morphology were quite prominent and explanations for those changes (at least in part) were not known at the time. Mitochondria had greatly reduced cristae membrane surface and very much increased matrix. In addition, a ballooning of some portions of the mitochondria “distorted” parallel cristae as if being squeezed to one end or the other of the mitochondrion.

These alterations were accompanied by striking decreases in mitochondrial function in vitro.

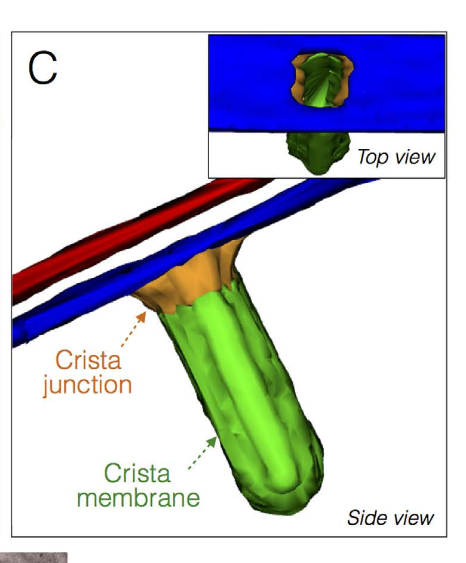
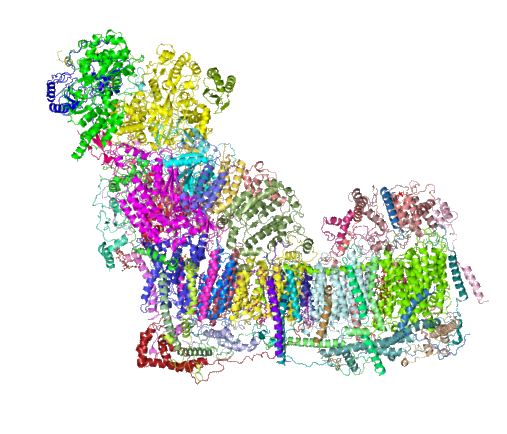
Two publications (Daves et al 2011, Daves et al 2012), might shed some light on the shape of cristae (that is their lack of a traditional cristae shape) and possibly relevant to the ballooned matrix of the mitochondria in KO mice. This is regarding the ability of ATP synthase dimers to “bend” the cristae membrane at an angle and being responsible for the acute angle on the edges of flattened cristae, as they are located on ridge area of cristae. The abrupt curvature is classic for mitochondrial cristae particularly in heart muscle, and skeletal muscle, but also in liver, and less prevalent in mitochondrial cristae morphology some other tissues. Also seen within cristae are small round pickets of a homogenous relatively electron dense protein. No explanation for the latter have been found yet.

Metal? cristae inclusions in mitochondria

I found a paper that showed a TEM of a dense round intracrista inclusion that had some similarities to what is seen in the Gclcwc/ii hepatocyte specific KO mouse at 50 post natal days.  Paper is Characterization of Intracellular Inclusions in the Urothelium of Mice Exposed to Inorganic Arsenic Toxicological Sciences 137(1), 2013 by Puttappa Dodmane et al. I cut and pasted part of one of their electron micrographs of a mitochondrion with such an intracristae inclusion (right side of picture) next to what is seen in the KO mouse (my picture, left side of image).


Mitochondrial and ER inclusions, and nuclear invaginations in Gclc hepatocyte specific KO mice

Hmm. Is there a possibility that the inclusions in the inter-cristae space of mitochondria, the inclusions sometimes seen in nuclei (probably invaginations), and the iron-like dense inclusions in the ER hepatocyte cytoplasm, are linked by enzymes that are involved in the maturation of cellular Fe/S proteins for which mitochondria are important. These images are from Gclc hepatocyte specific KO mice, one image (with the nuclear invagination with iron-like spicules upper left) came from a KO that was rescued with NAC the other two micrographs are from wc/ii mice, unrescued, at day 50.

What kind of diagram is this? mitochondrial cristae

I find that diagrams and illustrations for science are so often NOT GOOD, NOT EXPLANATORY, and are TOTALLY CONFUSING.  Here is an example. It is from a very nice article, (Biochimica et Biophysica Acta 1793 (2009) 5–19), but the diagrams of the arrangement of cristae just doesn’t make visual sense.  It is an injustice to readers to create confusing images and put them up as learning aids.  THis diagram misuses the shading when it creates a look of 3dimsnsions…. it makes no visual sense in any of the three drawings in this figure.  To create shading on one portion of a diagram (e.g. the middle figure) which in this case was the intercristae space, which is called the intermembrane space, and NOT make the shading equivalent on the mitochondrial matrix is just careless, and misleading. The lower diagram is beyond deciphering…. it looks like there are three orange fingers poking up, from a space with holes.  Nothing resembling anything that is shown with real TEM images.  So sad.  It wastes time and  sends wrong information.

Mitochondrial intracristae-space inclusions

Mitochondria provide the cell with energy as well as integration of metabolic pathways for biosyntheses of heme, iron–sulfur clusters, and nucleotides, triggers for cell apoptosis, and reactive oxidative species signaling and includes a circular mitochondrial DNA (a few thousand copies) of about 16.5kb which encodes for some peptides which are required for oxidative phosphorylation, which are transcribed and translated to mt-mRNA, mt-rRNAs and 22 mt-tRNAs, and their own mitoribosomes within the mitochondrial matrix. Many other protein (several hundred) are encoded by nuclear DNA, transcribed, modified in the cytoplasm, then imported into mitochondria. Nucleoids (the mtDNA and associated proteins are ascribed a size (not by me) of something around 100nm) (which means they should be visible in routine transmission electron microscopy.
Looking through many micrographs from my own collection i found several which had unique inclusions within a membrane space (maybe a crista space) which reminded me of the fine texture of DNA in an apoptotic cell which had been digested down into the 2000 to 250bp fragments (laddering of nuclear DNA), actually maybe even finer texture. red dots=approximate size of a cytoplasmic ribosome, bars=approximately 270nm. several micrographs derived from 2 experimental mice, hepatocyte specific knock out of the Gclc gene. 50days old. Mitochondrial changes have been reported (HEPATOLOGY 2007;45:1118-1128) in these animals previously, but intra-cristae inclusions were not reported. These mitochondria have an extreme expansion of the matrix area, pressing cristae to the sides, of the mitochondrion.  Interestingly, there really isn’t a lot of substructure to the matrix (as one might expect some mitoribosomes or mtDNA clusters

What is this?

The most common title for any post on this blog is “what the h*** is this.

This is an actual diagram, so bad, so unbelievably bad, that if you showed this to me as a microscopist i would laugh out loud when you told me what it represented. If i were an artist, I would laugh out loud saying, well, you missed the boat.  I am not being mean, or nasty, just sitting here incredulous at this red and green and blue thing that in no way depicts what it is supposed to represent.  it is fake-news.  it confuses, and undoes what one is trying to learn, it makes reading a scientific article much more difficult.  What is it about scientists that makes them unable to represent what they study in pictures…. what is it about artists that cannot comprehend the concepts that scientists are trying to portray.

This diagram is sjpposed to be a 3D representation of a tubular crista from a mitochondrion from muscle tissue….  i wont even tell you what it looks like to me…  There is fake 3D modeling of the membrane, and the red and white and blue lines…. are supposed to be WHAT?   I have looked at tens of thousands, maybe millions of mitochondria with TEM and this just makes me cringe.

Get with it you scientists…..  inform your artists and diagrammers, think about how and what you are asking them to represent, and check to see if it matches “reality”…pay attention to the figures in your publications lets you do something like this.

Puzzling? structures with structures

Aside from the fact that the word “structure” has been usurped by the molecular biologists from the microscopists, both show structure. The new puzzle is to fit the two together. I personally know nothing about protein structure but know a little bit about cell structure… so the deal is to find where the two can become one.  This of course is now accomplished by computational microscopy and better resolution, none of the equipment or funds for me to play with, BUT i still enjoy finding what is available online and working to understand that about which I am curious.

Beginning with the paracrystalline proteins in some mitochondrial disease states it became a puzzle to try to solve: that is, what proteins are making this brick-like inclusion in the matrix of mitochondria (see previous posts).

Just beginning with — Complex I (NADH:ubiquinone oxidoreductase) critical to energy metabolism in mammalian mitochondria on the inner mitochondrial membrane I used RCSB PDB to play with the purely “visual” issues of the protein. First diagram below…. shows a band in the transmembrane portion which by my eye is quite different than the rest of the structure in terms of color – and therefore leans toward hydrophobicity (according to the coloration charts of RCSB PDB). This model (which is to be taken “generically” of the NADH ubiquinone oxidoreductase I have shown on as a view from the nominal R and L (the bumby lump (arrow with no text) which I am assuming from the pale color is neither hydrophobic nor hydrophilic? just above the intramembrane “box” on the L). I doubt there is a “right or left” but for descriptive purposes, the front back – right left has been shown because they are so different, except for the transmembrane portion which is clearly a band that goes through and through. The inner mitochondrial membrane is from a diagram I did earlier… but gives a suggestion of the orientation of the NADH ubiquinone oxidoreductase that i have found for this in other diagrams online.

So now to add some other diagrams which give more fun images. This one, oriented identically to that one above, shows alpha helix area (bright pink–also according to the charts of the RCSB PDB viewer guide) that is within the bounds of the inner mitochondrial membrane. When one rotates the ribbon molecule, they are all neatly aligned perpendicular to the length of the membrane. I have to assume that they fit within the lipid realm of the trilaminar membrane.

Here is an edit to fit the group and an electron micrograph. Ha ha… probably too big…I will have to google the size of the molecule relative to the 3-5 nm thickness of the trilaminar membrane. within the band of the mitochondrial membrane it is easy to see a change in aminoacids by the increase in grey coloring in that area. This model is by element, the amino acids in the central region are mostly isoleucine, leucine, proline, and phenylalanine which RCSB has colored with very close shades of grey, hence the slighly more grey look to the transmembrane part of this molecule.

And the ribbon molecule emphasizes the vertical order in the transmembrane band….  I know there isn’t really anyone out there who doesn’t already know this, but the visualization here really makes it so apparent. Sheep – entire respiratory chain complex 1 ribbon diagram from a different database. .
and Cryo-EM structure of human respiratory supercomplex I1III2IV1


Mitochondrial inclusions

Liver from a rhesus monkey shows some mitochondrial inclusions.I found creatine kinase inclusions – paracrystaline but they appeared to be continuous with cristi membranes, SO MAYBE this (as found by someone else below) is not a perfect match but certainly a better match than a summary of the mtDNA mutations which are even more awesome than the paracrystaline inclusions in the monkey liver here. (anm# 97A mid lob, liver, control biopsy december 1974, negative 5743, block 4360, modified karnovsky’s, Epon 812 – to the best of my knowledge).

I havn’t included all the links, but ONE link i am adding which was an awesome summary of different paracrystaline and concentric cristi arrangements. FIND THAT ARTICLE LINK HERE. Mitochondrial inclusions, in general, would be a great topic for study, relating them to various over production of proteins, oligomerization, and loss of function.

YES: GRAVITY is part of the environment

How awesome is this study?  Ha ha…. having been in environmental research for 4 decades, never once did i consider looking at cells without the affect of gravity, and not to make a really bad pun, the gravity of the loss of gravity. FIND THE ARTICLE HERE. This group presents some great micrographs of the nucleolus….  I cant wait to see if the non-bilateral division of the nucleolus in one of their figures can be expanded to the very definite bilateral organization of the nucleus in general which is seen upon preparation for mitosis.