Category Archives: Nuclear pores and nuclear architecture

Nuclear pores and nuclear architecture transmission electron microscopy

More nuclear pore measurements

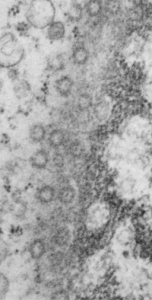
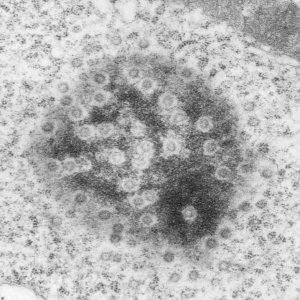
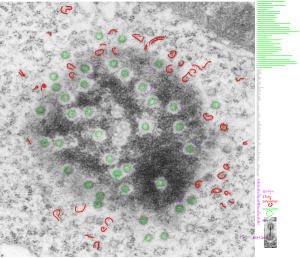
This hepatocyte was from a mouse (#5) which was a 14CoS nujll that did not receive NTBC as a rescue drug. This is 24 hours into the neonatal period.  Nuclear pores have fewer central densities (presumably being proteins transported). I am measuring for distance beside the nuclear pore that the chromatin exclusion zone hoping that differences will show up with various conditions in previous experimental models.

Top micrograph, unretouched, bottom micrograph, pores used in calculation have circles, red dot = a 27nm ribosome, purple dots are areas of the chromatin just adjacent to the chromatin exclusion zone surrounding the nuclear pore.

meaurements of the chromatin exclusion zone around the nuclear pore transmission electron microscopy

Nuclear pores and polysomes and other things

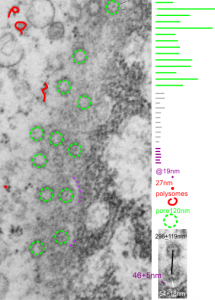
Continuing an evaluation of nuclear pores in various experiments from the past, here is a microgaph from 17709_65053_14CoS-/- NTBC 1yr. I used some of the opportunely sectioned “almost top down” cuts of nuclear pores to look at the inter-pore distance (which here measures , the chromatin exclusion zone, and the distance between the adjacent chromatin areas that have that “beads on a string” look.  Distances are derived from an approximate size of the ribosome at 27nm in diameter, nuclear pore diameter of 120nm, and a 19nm diameter for the adjacent chromatin at the edge of the chromatin exclusion zone.

Unretouched photograph of portion of a nucleus from an hepatocyte from CoS-/- mouse maintained on NTBC for 1 year.  and the marked-up micrograph below.

The nuclear exclusion zone is 54nm+18, the inter-pore distance is 289+119nm, and the distance between the densities in the chromatin (purple dots) of the edge of the chromatin exclusion zone is 46+5. Red curly-cues are polysomes, red dot is one ribosome (taken at 27 nm). Green 8-edged rings are nuclear pores. (bottom picture)

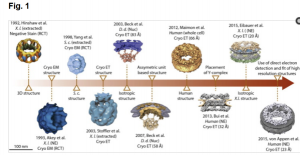
Incredible work: decades of observation but awesome outcome

I rarely like to give praise to single papers because I know that the contributions of some individuals rests on hundreds of thousands of tiny “scientific breakthroughs” made by hundreds and thousands of individual researchers. But this paper has such detail about the nuclear pore and the protein positions that I just had to link to their article.  They graciously quoted several articles using cryo-em that have lead to further understanding of the structure-function relationship..

I am so eager to use this type of diagram and see what changes can be measured in the nuclear pore (from the myriad TEMs I have ) relating to such things as elevated “oxidative stress” and “in vitro” conditions.

Nuclear pore gallery-2

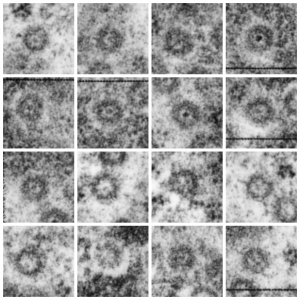
Adding more profiles of nuclear pores, from several different knock-out mice, basically to see whether the parameters I have set (chromatin exclusion zone, nuclear pore to nuclear pore distance, and distance between 20 nm DNA particles) changes with metabolic, or oxidative, or cell cycle (including apoptosis) stressors, and to see whether densities (probably pre-mRNA and other larger proteins that show up as occupants of the center of the nuclear pore) can be found to vary with similar cell states.  I subjectively choose the nicer looking pores, tending to bet mid-cuts, and some subconscious bias likely causes me to choose those pores with transport molecules, as here about 87% of pores have center densities, while when counted in a single micrograph (not my selection) the ratio of pores with and without central densities is closer to 50%.  we will see. The octagonal symmetry is very clear.

nuclear pores top down transmission electron micrographs


Measurements of areas surrounding the nuclear pore: hepatocyte


Some measurements (see previous post for comparison data), might be useful in a relative sense to others looking at nucleus, nuclear architecture, and nucleolar architecture.

This particular image is unretouched tangential section of an hepatocyte nucleus (17529neg73229block, anm203,wcii -Gclc 28d).  There are numerous nuclear pores sectioned tangentially in this image, about 35 of which are there 15 or so in sufficient detail to demonstrate a density within the center of the nuclear pore demarcating the site that pre-mRNA and larger particles are ushered through (both ways) (about 44%). Compare this micrograph with a previous post of a similar tangential section for parallel measurement.  They are not identical, but close. Curley red lines demarcate polysomes.

In this micrograph the pore to pore distance is n=34 x=482+177nm, the distance from the outer part of the nuclear pore to adjacent chromatin is n=97, 62.7nm +/-32nm, and the distance between the 19-20 nm beads on a string in the chromatin next to the chromatin exclusion area is n=39, 46nm +/- 13nm. The actual measurements are shown at right (green=pore center to pore center), grey=chromatin exclusion areas, that is the distance between the edge of the nuclear pore and the adjacent chromatin, grey, and purple, the distance between the 20nm beaded-periodicity found in the pore-adjacent chromatin.

electron micrograph hepatocyte measurements of nuclear pore and exclusion area and chromatinelectron micrograph hepatocyte measurements of nuclear pore and exclusion area and chromatin

Nuclear pore gallery-1

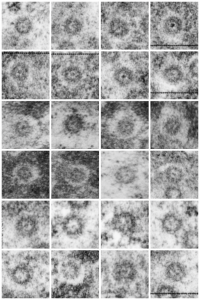
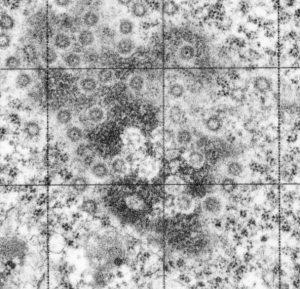
A collection of nuclear pores (top down) from a single tangential section of an hepatocyte nucleus from a mouse +/- for 14CoS (as opposed to the null). These show that about three quarters of the nuclear pores have some kind of transport item (like a pre-ribosome, or something else) being imported or exported all the time.  Just afun look at these adjacent pores. (excuse the morphometry grid from my inkjet printer back in the days when point counting was the method of choice for gathering numerical data from TEM images.

So these from a single cell show something about morphology… and the distance of the heterochromatin exclusion area surrounding the pore and the inter-pore distance and the size of the chromatin “beads on a string” in the adjacent chromatin I posted before.

Surrounding elements to nuclear pores: measurements

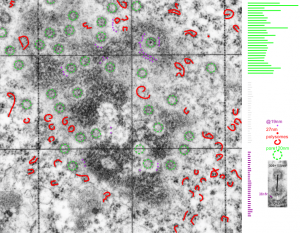
Some measurements, just made for my own information, might be useful in a relative sense to others looking at nucleus, nuclear architecture, and nucleolar architecture. Some data exist of course, but In the dataset that I am putting together from many different experimental protocols (archived) might lead to some new insights on numerical density of nuclear pores during times of cell stress, apoptosis, and in previously studies KO mice.  The numbers are meant to be “observations” and a suggestion.

This particular diagram has as its background  (top image) unretouched, and from a group of micrographs which were used for morphometry (hence the ink jet grid on the surface). It is hepatocyte, from a +/- 14CoS mouse which did receive NTBC (as a control for experimental mice receiving NTBC (data here) but showed pretty normal histology – but I predict with enough time and scrutiny something would show up. Octameric nuclear pores are shown as green dotted circles, ribosomes and polysomes presumably attached to the outer nuclear membrane, red, ribosomes, red = @27 nm diameter, peri-pore chromatin beads diameter, @19-20nm. Condensed chromatin at the inner nuclear membrane is well defined and “wound” in many places as a fibril also, possibly around 20+ nm diameter but longer lengths. About %66 of nuclear pores in this photo have central densities indicating some molecule is in transport one way or the other.

This particular animal had a great tangential section showing a large portion of the nucleus studded with nuclear pores and I used that opportunity to make some measurements on the diameter of the chromatin with beads (@19nm)-on-a-string appearance adjacent to the nuclear pores but outside the chromatin exclusion area around the pores and the distance between those beads (38nm); to measure the width of the chromatin exclusion area at places around the nuclear pores (maybe 2 -5 measurements perpendicular between pore and chromatin, per pore) (60nm+ 7nm and to measure the pore to pore distances as well (n=27, MEAN, 309nm+ 109nm (SD)).

HeLa cell granular chromatin organization after irradiation with 30 joules UV?

Here is kind of an interesting set of features in this clump of granular component of the nucleolus (or may just be condensed chromatin) that has a checkered appearance in some places (see checker boxes in inset micrographs to the right of the original image one showing the unretouched sections and an identical one with a checker pattern highlighted). There is a definite order to the spacing… or banding or filament pattern, something around 125 nm for the top two inset images, and for the bottom inset images, around 50 nm (which goes along with most measurements — being too big for interchromatin clusters granules (20-25nm), splicesosomes, around 30 nm, possible speckles? which are more like 50-100 nm).

HeLa cel electron microscopy nucleus

Nuclear pores: HeLa cells after irradiation with 30 joules UV

Nuclear pores: HeLa cells after irradiation with 30 joules UV — from an experiment trying to figure out how inhibitors of some of the caspases affected apoptosis. This study was from the 1980s and there are some interesting things never mentioned in that study which can be useful to someone out there doing electron microscopy on the nucleus.

There can be no doubt that some controls on nuclear size shape and activities are changed in HeLa cells… probably so different than the HeLa cells which started out way earlier than that. But while looking over “nuclear pores” in a different study I just happened to look over nuclear pores in this HeLa cell which had been exposed to 30j of UV.  I can find some evidence of nuclear pore cytoplasmic filaments but no nuclear pore baskets. So this is an N of 1, therefore not significant in and of itself, but when I googled nuclear pores and HeLa cells, there were publications, thus it is not an unusual, nor never-seen, entity.

Some of the central densities are missing from these nuclear pores as well.
nuclear pore electron microscopy HeLa cells irradiation Other interesting features include the “presumed” granular portion thee is a pattern, both on the upper margin before the “neck” (whose significance is not known) and also on the surface past the “neck”, I have put a checker board behind elements which appear to be organized into alternating space.  There are cytoplasmic filaments seen below but no nuclear side basket.  This is the most perpendicular section seen in this micrograph.

Nuclear inclusion/invagination? which?

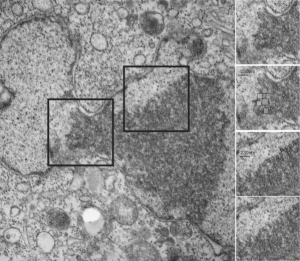
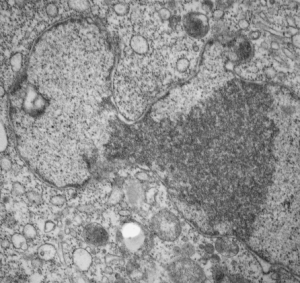
16040 65718 liver 14Cos 24 hr no NTBC, unidentified cell, not likely an hepatocyte, maybe an interstitial cell. Mitochondria in adjacent cells top left and right have condensed mitochondria.  One of the interesting things about the “inclusion” in this nucleus is that it does not resemble any cytoplasmic structure in the cytoplasm of that cell, in fact the cytoplasm of this cell is quite different with lots of vacuoles (lower left) and an ill-defined shape, on one side very scant cytoplasm, which makes it less likely to be an hepatocyte than an interstitial type cell.

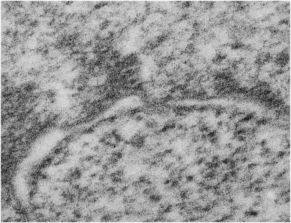
Three areas along the margin of the inclusion have been cut and enlarged (denoted by the three boxes in the original micrograph). The inset at the top shows there is really no distinct double membrane typical of the nucleus (inner and outer membranes and nuclear pores) and this might be a tangential cut-artifact. In the inset from the middle left, theer is a band of chromatin along the left border of the inset but again, no double membrane typical of nucleus. The inset from the lower right abuts up against nucleuplas which is very electron lucent, but along this area there is a density to the inclusion which looks like it might be some kind of lamin proteins.

Another great feature is the constriction appearing in lower middle of the inclusion, densities that look like they might have been some kind of “ring” around part of this structure.

Ribosomes (estimated at 27 nm in diameter from the cytoplasm have been enlarged with the insets (also shown in the original).  Bar is 10x the ribosomal diameter at approximately 270nm.

The inclusion/invagination is full of robosomes and RER membranes (I guess that is what they would be named) with an homogeneous appearance and the vesicles or RER appear to be dilated to about the same uniform degree.

There is a nucleolus just above the inclusion. Animals with genotype undergo a pan-apoptosis among hepatocytes within a few days of birth, this doesn’t look like apoptosis yet, and also doesn’t appear to be an hepatocyte.

electron micrograph liver 14Cos ko mouse