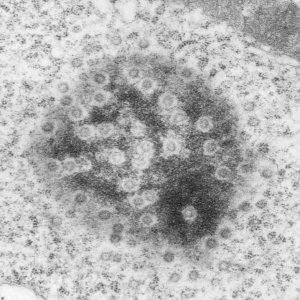
This post is just for fun, as when i was looking at some electron micrographs of the Gclc mouse liver study I found this critter, just with big eyes (one of which i added the pupil to using photoshop — my apologies) but otherwise not retouched. The exact data are neg17894_block74138_animal706_wcii_NAC. Initially I was interested in the nucleoli, but naggingly amazed about the “devil” appearance of the nucleus as a whole.
Color was of course added using photoshop, all else remains the same. When considering what to call this character i googled “names for satan” and behold, the list of about 66 names from various cultures and groups showed up (cut and pasted from Wikipedia (thank you wikipedia) (below).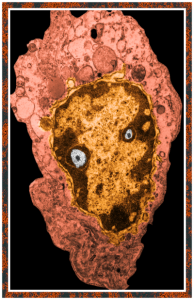
Abaddon—(Hebrew) the destroyer
Adramalech—Samarian devil
Ahpuch—Mayan devil
Ahriman—Mazdean devil
Amon—Egyptian ram-headed god of life and reproduction
Apollyon—Greek synonym for Satan, the arch fiend
Asmodeus—Hebrew devil of sensuality and luxury, originally “creature of judgment”
Astaroth—Phoenician goddess of lasciviousness, equivalent of Babylonian Ishtar
Azazel—(Hebrew) taught man to make weapons of war, introduced cosmetics
Baalberith—Canaanite Lord of the covenant who was later made a devil
Balaam—Hebrew devil of avarice and greed
Baphomet—worshipped by the Templars as symbolic of Satan
Bast—Egyptian goddess of pleasure represented by the cat
Beelzebub—(Hebrew) Lord of the Flies, taken from symbolism of the scarab
Behemoth—Hebrew personification of Satan in the form of an elephant
Beherit—Syriac name for Satan
Bilé—Celtic god of Hell
Chemosh—National god of Moabites, later a devil
Cimeries—Rides a black horse and rules Africa
Coyote—American Indian devil
Dagon—Philistine avenging devil of the sea
Damballa—Haitian Vodou serpent god
Demogorgon—Greek name of the devil, it is said should not be known to mortals
Diabolus—(Greek) “flowing downwards”
Dracula—Romanian name for devil
Emma-O—Japanese ruler of Hell
Euronymous—Greek Prince of Death
Fenriz—son of Loki, depicted as a wolf
Gorgo—dim. of Demogorgon, Greek name of the devil
Haborym—Hebrew synonym for Satan
Hecate—Greek goddess of the underworld and witchcraft
Ishtar—Babylonian goddess of fertility
Kali—(Hindu) daughter of Shiva, high priestess of the Thuggees
Lilith—Hebrew female devil, Adam’s first wife who taught him the ropes
Loki—Teutonic devil
Mammon—Aramaic god of wealth and profit
Mania—Etruscan goddess of Hell
Mantus—Etruscan god of Hell
Marduk—god of the city of Babylon
Mastema—Hebrew synonym for Satan
Melek Taus—Yezidi devil
Mephistopheles—(Greek) he who shuns the light, q. v. Faust (Greek)
Metztli—Aztec goddess of the night
Mictian—Aztec god of death
Midgard—son of Loki, depicted as a serpent
Milcom—Ammonite devil
Moloch—Phoenician and Canaanite devil
Mormo—(Greek) King of the Ghouls, consort of Hecate
Naamah—Hebrew female devil of seduction
Nergal—Babylonian god of Hades
Nihasa—American Indian devil
Nija—Polish god of the underworld
O-Yama—Japanese name for Satan
Pan—Greek god of lust, later relegated to devildom
Pluto—Greek god of the underworld
Proserpine—Greek queen of the underworld
Pwcca—Welsh name for Satan
Rimmon—Syrian devil worshipped at Damascus
Sabazios—Phrygian origin, identified with Dionysos, snake worship
Sammael—(Hebrew) “venom of God”
Samnu—Central Asian devil
Sedit—American Indian devil
Sekhmet—Egyptian goddess of vengeance
Set—Egyptian devil
Shaitan—Arabic name for Satan
Shiva—Hindu the destroyer
Supay—Inca god of the underworld
T’an-mo—Chinese counterpart to the devil, covetousness, desire
Tchort—Russian name for Satan, “black god”
Tezcatlipoca—Aztec god of Hell
Thamuz—Sumerian god who later was relegated to devildom
Thoth—Egyptian god of magic
Tunrida—Scandinavian female devil
Typhon—Greek personification of Satan
Yaotzin—Aztec god of Hell
Yen-lo-Wang—Chinese ruler of Hell
Category Archives: Glutamate cysteine ligase catalytic subunit KO mice
Measurements of areas surrounding the nuclear pore: hepatocyte
Some measurements (see previous post for comparison data), might be useful in a relative sense to others looking at nucleus, nuclear architecture, and nucleolar architecture.
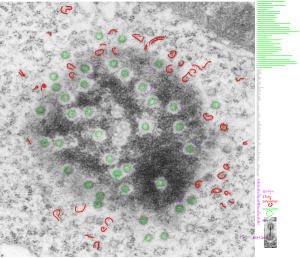
This particular image is unretouched tangential section of an hepatocyte nucleus (17529neg73229block, anm203,wcii -Gclc 28d). There are numerous nuclear pores sectioned tangentially in this image, about 35 of which are there 15 or so in sufficient detail to demonstrate a density within the center of the nuclear pore demarcating the site that pre-mRNA and larger particles are ushered through (both ways) (about 44%). Compare this micrograph with a previous post of a similar tangential section for parallel measurement. They are not identical, but close. Curley red lines demarcate polysomes.
In this micrograph the pore to pore distance is n=34 x=482+177nm, the distance from the outer part of the nuclear pore to adjacent chromatin is n=97, 62.7nm +/-32nm, and the distance between the 19-20 nm beads on a string in the chromatin next to the chromatin exclusion area is n=39, 46nm +/- 13nm. The actual measurements are shown at right (green=pore center to pore center), grey=chromatin exclusion areas, that is the distance between the edge of the nuclear pore and the adjacent chromatin, grey, and purple, the distance between the 20nm beaded-periodicity found in the pore-adjacent chromatin.
Heterochromatin exclusion area around the nuclear pore
One cell from the liver of a control (sort of) for the Gclc ko mouse (that is that it had one wild type allele for the gene for turning on albumen synthesis (WC/ii ) which rescues the would-be Gclc-/- mouse from death. This hepatocyte is not really remarkable to me but it did have this great tangential section of the hepatocyte nucleus and the nuclear pores were just scattered all over the area sectioned making the uniformity of the condensed chromatin areas surrounding the pores very visibly7 consistent. It was so nicely consistent that I decided to try an afix a casual, but hopefully useful, measurement to that exclusion zone, at least in the this particular animal model.
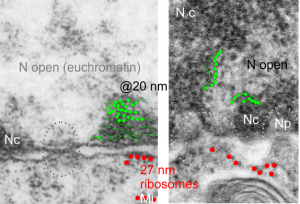
So, that distance (based on the 27nm size of a mammalian ribosome turns out to be the following: mean distance, 58nm. From the original scanned image 58 nm+/- 16nm. That makes the space around the nuclear pore sort of a ring, of about 55 nm. Black line composit measurements, see bottomright. Red dot = one ribosome, 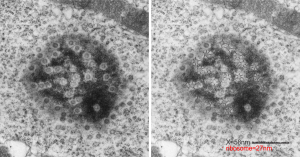
Working out dimensions of nuclear and nucleolar components from archived electron micrographs of hepatocytes
It is nice to read that something is measurable, that has a dimension in nm that one can put into some kind of life-perspective. I don’t know how accurate those individuals were in giving a distance measurement to their images are, and I am giving each the benefit of the doubt in terms of attempting to be accurate) i guess they are quite accurate. I know for myself, using three or four different electron microscopes, and various different paper products, films, dryers, etc, that there is shrinkage, stretching, and all sorts of changes that have occurred over time (even 35 years) that affected the dimensions of objects on the micrographs, even though by a very small amount.
I am using 27nm as an internal control for magnification+enlargement of images. In this case, the 27nm red dot, in all images has been derived from about a dozen ribosomes, and labeled as such. The green dots are about 18-20nm in diameter in these micrographs, and strung as if “beads on a string” (not the beads on a string of nucleosomal DNA, but production of preRNA in the nucleus?) but is it not strange that there is a repeated motif – that is- beads on a string- showing up a lot, both in the nucleoplasm, the nucleolus and the cytoplasm (ribosomes on mRNA) as a kind of “convenient” little pattern. And who knows where else this pattern might be found). So the green dots show this motif, in a parallel-linear pattern, in the condensed (or closed compartment) chromatin. Both of these examples come from Gclc ko mouse hepatocytes. Red dots are ribosomes.
Liver: Vesicles within vesicles – electron micrographs
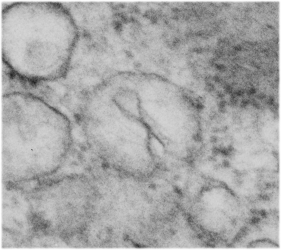
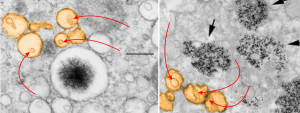
I have not really found the equivalent of the electron dense particles in the RER of Gclc mice (posted yesterday) for conditional liver ko animals rescued with NAC at 60d. I have also not found an equivalent (googling and other pathology type searches) for the iron spicules found within those partially RER vesicles. However I did come close to finding a match for the vesicles within vesicles (though these cells were in vitro, not liver, and not in vivo). The partial publication URL which shows iron particles (USPIO nanoparticles at iron concentrations of 50 μg/ml)(link here) which are NOT LIKE the spicules found in the mice I am looking at, but does show something like the vesicular changes, that is, the vesicle-within a vesicle configuration.
I have pseudocolored the vesicles to compare orange, and on the left is the image from the Gclc conditional ko rescued with NAC, and on the right is the cell line (Canine ADSCs or canine adipose derived stem cells) treated by these researchers with iron. Red arrows point to the vesicles within vesicles, black arrow from their micrograph point to nanoparticles of iron. Heavy metal (maybe iron in left hand micrograph) looks like a fuzzy black iron filing mass pulled by a magnet into a glump, very different from the iron in the micrograph on the right. It is critical to point out that the vesicles are pretty much ribosome free, while those RER bound objects with electron dense (presumptive iron) have ribosomes, at least over part of their surface.
 Here is another example of metal (in this case aluminum) in tissue culture forming dense lysosomal bodies.
Electron micrograph of liver: Alb w/c Gclc i/i D60 NAC rescue – color
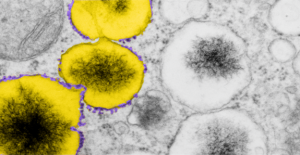 A portion of the previous post has been enlarged and also pseudocolored in photoshop. The ribosomes from this portion of an hepatocyte are colored purple, this is mainly to emphasize that whatever these vesicles are in the cytoplasm of the rescued mice do have some kind of protein being produced. The portions of the vesicle membrane that are occupied by ribosomes is not that great, when found, too, they assume a position as if a string of 4-8. The vesicles in tandem, themselves are colored bright yellow. The contents of the vesicles needs no coloring it is very electron dense and likely to contain iron, be iron, or some other combinations of metals.
17902_74138_706_wcii_nac_60d_(colored). Please note that on the right hand side, unretouched vesicles and inclusions are found, just in case you need to check. On the left hand side of the lowest vesicular blip, find three very nice ribosomes, but the remainder of the vesicle has but one or two additional ribosomes about the periphery.
Electron micrograph of liver: Alb w/c Gclc i/i D60 NAC rescue
The four (maybe there are more) things that I noticed about the GCLC conditional KO mouse hepatocytes were 1: vesicles within vesicles, 2: lucent areas of mitochondiral matrix adjacent to quite well organized stacked cristi, 3: iron-like staining spicular deposits in dilated RER of hepatocytes, and 4: there is a linked-look between the ballooned areas of the ER (both smooth and rough).
These mice have survived the KO of GCLC, for 60 days, because they were rescued with N-acetyl-cysteine (NAC). NAC reportedly helps replenish the intracellular glutathione supply and can lessen hepatocyte oxidative damage occuring with the knock out of glutamate cysteine ligase catalytic subunit (Gclc), explained HERE. NAC affords protection against the oxidative stress, DNA damage and cancer development and cell death, thus rescues a genetically determined depletion of hepatocyte glutathione. I examined a large series of mouse tissues from these animals and their appropriate controls and while some of these data were published, there was much that never made it into the literature. Thus…. these posts, hoping that someone can be helped by these electron micrographic images of the unrescued, the controls and the NAC-saved mice.
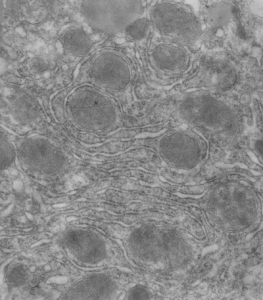
So the micrographs below have RER (albeit the ribosomes are really not that nicely arranged in spirals or grids) and the transition from RER to ER is not consistent with typical RER to SER transitions (that is; both small and large vesicles, empty and full of electron dense filaments; those with center vesicles and those without (almost like continuous segmented mini-intussuceptions, are kind of a large mix of different types, sizes, filled and empty vesicles. These vesicles begin to develope before D60 after NAC rescue, and increase with increasing time.
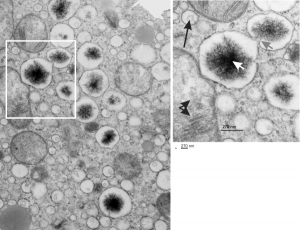
negative block and animal and treatment: 17902_74138_706_wcii_nac_60d. Size of a ribosome (at 27 nm) was used to calculate the bar markers (smallest black dot below. Inset from image on left is bounded with a white box, enlarge just around 2x on the right). Black arrow points to vesicle-within-a-vesicle phenomenon which is totally everywhere; double headed black arrow points to two types of mitochondrial inner membrane organization, one part points to areas which are quite electron-lucent, and one points to cristi that are highly layered and flattened. White arrow points to filamentous electron dense (i would like to say “iron filings” – like) inclusions and the grey arrow points to a telescoping point between two rounded contiguous vesicles with filamentous inclusions. Occasional ribosomes are seen on the bounding membranes of these vesicles, and as in this case, they look like peristaltic connections, dipping one end into the next rounded vesicle as if there were strictures, or boluses passing through a long undulating series of tubes. Thee are a few coiled ribosomes on an mRNA through out the cytoplasm, and not pictured some microbodies (dense bodies with uricase crystals). Image to right shows the open-closed RER, SER, ER profiles show internally.
Electron micrograph: liver: Alb w/w Gclc i/i D120 NAC
Electron micrograph: liver: Alb w/w Gclc i/i D120 NAC. So here is a perfect example of not having the right data written down while doing collaborative ultrastructure on a project for a colleague. So after so many years I have to assume that this is a control liver receiving NAC for 120 days after birth, for a conditional Gclc ko mouse.
Liver looks really nice, WNL in my opinion, nice RER, nice mitochondira, one part of a lipid droplet visible. I partially hid two pen marks on this micrograph (using the bandaid tool in photoshop) which you can still see, but this did not change any data. Contrast enhanced as well to even up the tone of the liver histology. liver, neg 17909, block 74119, anm#702, alb w/w Gclc i/i NAC 120 days post partum. 10000x orig mag. No profile of nucleus in this image.
