Daily Archives: January 2, 2017

Guinea pig alveolar type II cell granule protein: surfactant protein A?

Guinea pig alveolar type II cell granule protein: surfactant protein A?

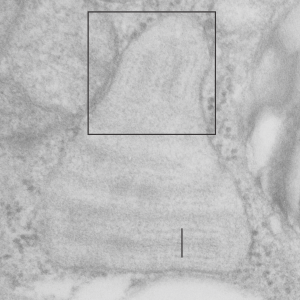
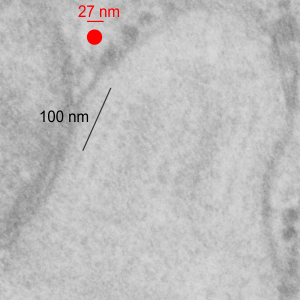
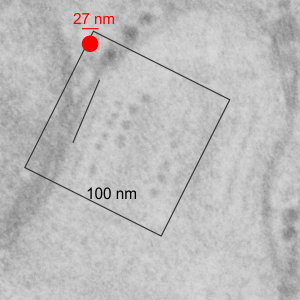
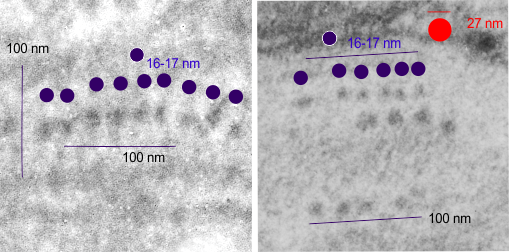
There are so many images which show the same data, layering, periodicities, hexagonal array at the growing ends of granules that the evidence that these are some regular sort of structure in select species is a little hard to ignore. I keep trying to convince myself that I am seeing what I think I am seeing.  This opportune section of an alveolar type II cell (from ferret) granule is just kind of nice, as it shows the growing end ribosomes, the stiffness of the RER profile when the protein begins to organize (seen on the left hand side of the micrograph) the looseness at the growing end before further oligomerization takes place in the granule (right hand side of the micrograph)  where it seems that there is some kind of organization soon after the protein leaves the ribosomes (like the hexagonal pattern for a top down view of surfactant protein A, as seen here (unretouched EXCEPT for the burn tool in photoshop to highlight what I have seen), though I would have liked to see more with the central dot.  Ribosomes were burned to highlight, and a ribosome marker (nominal 27 nm) are given plus a bar marker at approximately 100 nm, and hexagons at the growing end of the granule are burned as well.  Inset is enlarged from white box in top figure. 9835_17084_guinea_pig_#301

9778_31065_ferret_type_II_granule9778_31065_ferret_type_II_gr_inset

More on two levels of periodicity in alveolar type II cell granules: guinea pig

Below are some examples of an alveolar type II cell granule in an electron micrograph from a guinea pig lung which I am showing unretouched, and then enlarged, and same image with periodicity enhanced with the burn tool in photoshop, enlarged again and nanometer markers included in each increased magnification.

From the four figures below, it seems that the relative size difference in the periodicities and the number per nanometer is similar with dog.

Fig 1 (top) is from a guinea pig alveolar type II cell. Bar = 100 nm. Box is an area enlarged to become Fig 2, seen just below Fig. 1, which is an unretouched electron micrograph of a single granule.  It is easy to see the periodicity in the outer dark band and the lighter central band is different. This view is just a slightly tangential cut to the long axis of the granule. Figures 1-part of 5 are from 9835_17084_gpig_anm#301.

Fig. 3 shows the same image as Fig. 2, except that I have burned the densities (periodicities) in the middle less dense band (smaller dots) and the outer dense band (larger dots) so they are more clearly visible.

And in Fig. 4, the box indicated in Fig. 3 is rotated to show the periodicities and nanometer marks from a ribosome, the whole band-period of 100 nm, the periodicity and approximate diameter of the proteins comprising the smaller dots (approximately 15-17 nm in diameter seen as the purple dots), at about 5-6 dots per 100 nm, per the bar marker.

The next figure (Fig 5.) compares guinea pig (on the right) with dog, in a similar assessment of the middle band periodicities (dog on the left).  NB, the larger periodicities (from the outer dense bands of one basic period of this granule (100 nm width typically) are clearly seen in guinea pig images, but only slightly recognizable, find maybe two at most, in the image of dog.

9835_17084_gpig_periodicity-19835_17084_gpig_periodicity-29835_17084_gpig_periodicity-3gpig_dog_middle_line_periodicity_comparison