Monthly Archives: November 2018

N terminal of mini SP-D dodecamer: is it different in shadowed images?

Just a thought here….which came to mind while i swas measuring the arm length and CRD dimensions and N term lenght of 11 mini-SP-D molecules that there was something odd in the center of about half of them. The N terminal of mini SP-D dodecamer (White et al, mentioned frequently) sometimes has an odd look bundled up central portion. I copied and pasted these 11 images to compare them, and 4 out of 11 really did have a greatly bundled (and seemingly) a reduced length. Typical full length SP-D makes a dodecamer with an N terminal (which might also include a portion of the collagen-like domain… as the proportions given in diagrams and in number of amino acids in the N term seem to disparate, and not aligned with the lengths seen in the shadowed electron micrographic images). In particular however, the mini-SP-D with deletions in the collagen like domain show N terminals (about 36% of the time) which are “balled up” into dense areas. Just looking at the layout of 11 molecules below it is also apparent that in those images where the N term areas is balled up, the collagen like sequence (arms) are separate earlier.

In two of the four dodecamers on the right, the CRD of an arm is not clearly defined, there is the possibility that in those cases, the CRD has fallen back on the N terminal. Rejecting that idea, there are also images in the left hand column which have poorly defined CRD and they do not show balled up N terminals.  The nicer explanation is that somehow removing the C 3 and C 4 alters the way the N terminals bind together in the center.

That the bar portion in the center of SP-D and mini-SP-D has some of the collagen-like sequence seems

i think had i been doing this microscopy i might well have been advised to be absolutely precise in my measures of nm length.  In retrospect in my own career…. i should also have been more careful.

What does the collagen like portion of SP-D look like?

Haha….  It is so clear from electron micrographs that the collagen like domain of SP-D is pretty much straight, not quite, arc of xx degrees but I am searching for anyone who has modeled that portion.  In Phyre2 (i do not know how long this link will be active). I found two linear models for structural protein which are pretty close and have a slight curvature (though these are single lengths not wound trimers so shape would change.  it seems to be a reasonable guess that the two are pretty much similar. Here three molecules with high similarity to the following sequence for SP-D as a “hint” of what it might look like.  The following is what I putinto Phyre2(>collagen_like_domain_SP-D
GLPGRDGRDGREGPRGEKGDPGLPGAAGQAGMPGQAGPVGPKGDNGSVGEPGPKGDTGPSGPPGPPGVPGPAGREGPLGKQGNIGPQGKPGPKGEAGPKGEVGAPGMQGSAGARGLAGPKGERGVPGERGVPGNTGAAGSAGAMGPQGSPGARGPPGLKGDKGIPGDKGAKGESGLP)

Three molecules rotated top to bottom, and i will try to weave them together in a helix.  Below that is the closest modeled sequence shown on Phyre2 from which the structures were saved in

Protein feature view i am wondering if this is more or less to scale.

the N terminal plus 8 repeats in the collagen-like domain were not well modeled. (>Nterm_SP-D_plus_8_gxy
MLLFLLSALVLLTQPLGYLE (signal peptide) AEMKTYSHRTMPSACTLVMCSSVES (N terminal) GLPGRDGRDGREGPRGEKGDPGLP……….. (first part of collagen like sequence)

Difference in size of mini SP-D collagen like sequence from SP-D

White et al published images of a mini-SP-D which is lacking C3 and C4 exons from the protein. It interests me to examine the differences in curvature and kinks in the arms of the dodecamers and comparisons in length of the arms when those two portions are missing.

It was necessary to figure out what (if anything, i am just looking for answers) was wrong with their micron marker for the full length SP-D and it seems to me that it is off by about 120-125%.  This makes comparison with the mini-SP-D difficult.  Two different sets of re-calibrations of their image (one with grain size of the adjacent background and one using the oft published size for the full length SP-D dodecamer) are shown below… and this image is a replicate (with different results stemming from the measurement being from the point of crux of the N terminal (probably plus some of the collagen-like domain) to the center of the density that is the neck and CRD.  The second set of measures traverses the distance from the crux of the central portion to the edge of the neck and CRD with slightly smaller overall measurements.  You can see their original magnification puts SP-D at about 143nm rather than the “just over 100nm” that is consensus in the literature.

Mini surfactant protein D size (another set of measurements)

I redid this same image of mini-surfactant protein D, and made sure that the straight lines and the arc length lines were pretty closely spaced. This is a bit of a moral problem since I don’t think the exact location of the end of the collagen-like sequence, or even the beginning of that sequence are known. Especially in the center area of the molecule (both the rat unmodified SP-D or the mini, or human or whatever) the length of tethering in the SP-D dodecamers appears to be much greater (upwards of 25% of the total length of the mini-SP-D) than the number of “counted” amino acids for the neck and N terminal. The neck and CRD are modeled on RCSB as a unit, with the coiled coil neck not being exposed very much from the CRD to which it attaches –almost folded back upon.

There could be some close associations in the C1 exon of the SP-D collagen like domain that measuring from the “bifurcation” seen in the dodecamers does not measure. It seems likely that it is in the middle part of the collagen like domain because this measurement does not appear to have changed at all in the mini-SP-D.  But below is a repeat … and just my opinion, it isn’t going to make (at least with the mini-SP-D there is not much difference if arc length or straight length for the dodecamer arm is used for the measurement. Clearly one nm difference in the length estimated by these measures is smaller than the bias in the line drawings). I think it is pretty safe to say that mini-SP-D is about 70nm in diameter (that would be the diameter (70 nm) of a circle which intersects at least two of the CRD. Because of the similarity in measurements i will not do arc length for the mini-SP-D.

This measure of 68 or 69 nm for mini SP-D makes it about 60% the size of the full sequence SP-D.  Because the measures of the tethered portion of the center of the dodecamer and the CRD are so close in measures, one can assume that the reduction was somewhere in the middle of the collagen like sequence.

mini SP-D size in nm

Looking at a single molecule (out of 11 that are measurable (white et al) this first molecule looks to be about 57nm (diameter intersecting two opposite CRD). The measurements were made with an adjusted nm marker from their figure, as described previously. The 100nm bar is determined by a rat SP-D dodecamer and the measurements for the mini SP-D are calculated with this measure, and are therefore relative. This means that the whole molecule is reduced by to just over half the full size SP-D the deletions of exons they called C-3 and C-4 from the collagen like sequence. Calculating curvature of the four arms of the dodecamer (arc length) hasn’t been completed yet but will increase the length somewhat.

It becomes obvious that the diagram of the domains of SP-D and mini-SP-D by White et al, are not to scale.  See below.

Mini-SP-D size compared to rSP-D micrographs

The publication by White et al, mentioned in previous posts shows rat SP-D as well as a two genetically modified SP-D proteins (as dodecamers) which I am trying to analyze to estimate changes in arm length on micrographs after the deletion of exons (they referred to as C 3 and C 4 in the collagen like domain) from SP-D. Adjusting their original bar marker for magnification (this i adjusted on the basis that the CRD elements in the mini SP-D (abiyt 10.35nm) and the rat SP-D should be the “same or very similar” in size, and theirs was about 13nm which is 115 to 120% larger in the SP-D than the mini-SP-D which i don’t think it should have been. And also the background granules in the three panels were not the same, and were larger in their top image than in B and C, which seemed strange. Both measurements are given, that is, the difference between their original micrograph and the slightly reduced rat SP_D micrograph (so that the SP-D dodecamer is more along the size lines of what has been reported by countless authors before this particular publication) i.e. just over 100nm.
Also the relative differences in size of the “arms” of the dodecamers of the mini SP-D are given. the miniSP-D is about 33.3 percent of the length of the original SP-D dodecamer arm. I also look like the length measure will not differ from the arc length when measured using that dimension. IF you use their magnification marker for all images. If you use the size of SP-D adjusted so that the CRD are quite similar to the CRD in the mini SP-D, then the mini-SP-D arms are about % of the adjusted SP-D size. The mini SP-D and lower image of SP-D are relatively similar magnifications (at least as measured by their CRD.

Verge of a Dream: No refuge

I don’t know  where you are.
I don’t know who is lost.
No refuge in the shadeless palms.
I don’t know if life
once the flame
became the stone
in the fire’s place.
I wonder not, the souls
their days unnumbered,
no one counts, wander about
the parking lot, that like
these motors, oh their
unsweet heart
might not be fixed.

RLB@1991

Discrepancies in nm size of SP-D – more

Here is what i have figured out as a measure for the “real” magnification of panel A in the paper by White et al, 2008, on rat and mutant SP-D molecules.  My original observation was that the SP-D dodecamers were too large for their 100nm bar marker. That I attempted to confirm by creating two circles, one the size of their bar markers, the other a circle that intersected at least 2 of the CRD in the SP-D dodecamer.  The discrepancy was large, being about 132%.  I next could see that the background had a larger grain in A of their figure than B (and now i believe it is off even more in C) and measured that, and A was about 115% larger shadowing grain than B.  Thinking of different shadowing on different grids which must have some variation, I felt that could be improved upon, and surmised that the mutations in their mini SP-D was only in the collagen-like domain, not in the neck or CRD.  That said, I measured height and width of the CRD in panels A and B and compared the mean of those measures.  (there were 31 observations in panel A and 80 observations in panel B.  Some i didn’t measure as they were obscured by other details. The means and sd showed a significant increase in the size of the CRD in panel A over B.

Here is the micrograph, and the pink dotted lines show distances measured (a height and a width per CRD).  This too showed that A was about 115% enlarged over panel B. So now when one (as i will) measures the decrease in the collagen-like portion of the mutant (mini) SP-D, i will enlarge the images in mini SP-D in panel B before comparing them with the images from panel A.  That the neck and CRD in panel C are again smaller i wont work with this since there maybe some change (as observed in the “lack of separation” in some of the CRD in the images, so other things are changing the shapes there.  (please note that the background grain size is even smaller than in B. (so much hassle for such a simple error)
Thank you to two great websites which I totally love, as i can cut and paste from excel and get numbers i want.  SD calculator, and t-test calculator.

Discrepancies in nm size of SP-D

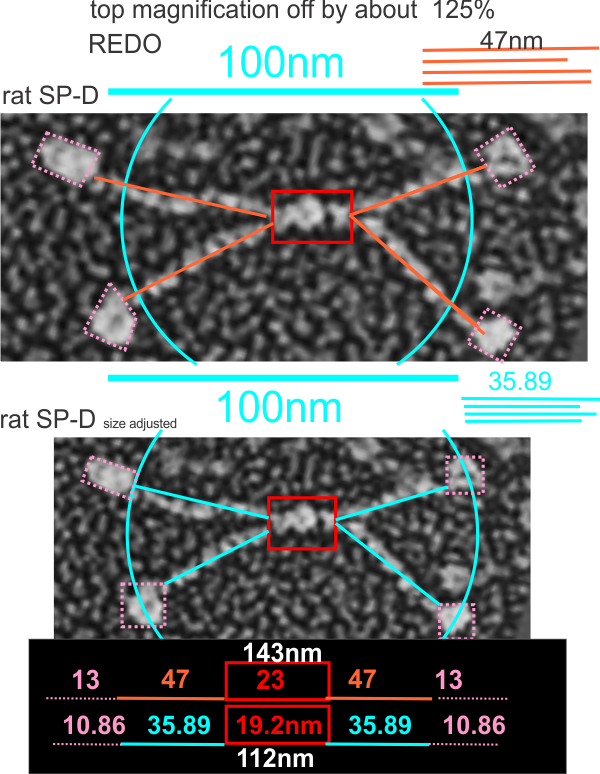
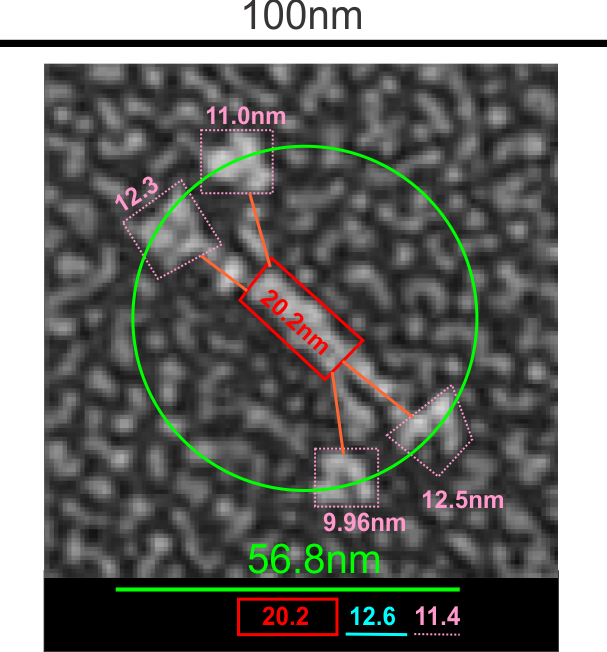
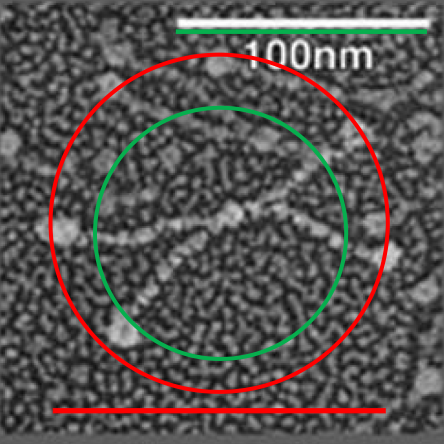
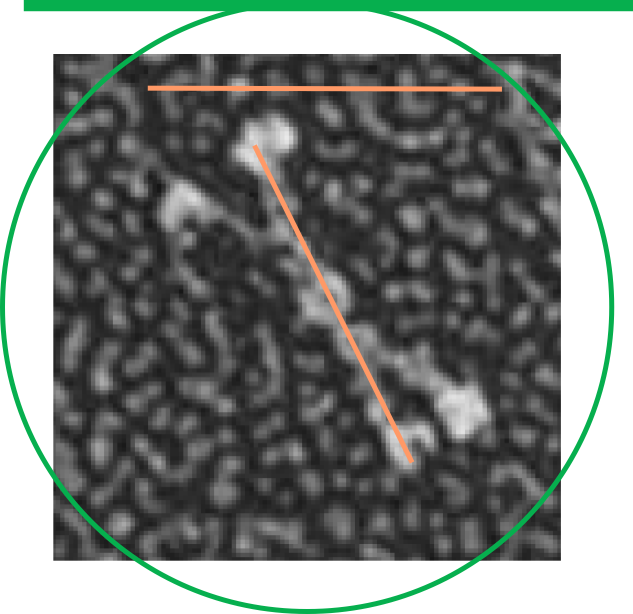
Here is where it become problematic when defining the size of anything as an absolute…. all these measures seen in publications need to be taken in a sense of wide variation in different reported sizes for the 100 nm micron marker.  Case in point, from White et al, their 100 nm marker (my green bar underneath their own white nm marker) and my green circle (the same length as the diameter as my green bar marker) are shown without changing anything on their image….. this molecule is at least a 132% over what most individuals report as the alleged size of the 100nm SP-D dodecamer molecule.  SO, if this rat SP-D dodecamer is that much bigger than the mini-SP-D which is claimed to be missing — “A rat mutant with deletion of two internal collagenous exons corresponding to exon 4 (C3) and exon 5 (C4) was generated by PCR overlap extension using full-length rat SP-D cDNA as primer”, how is one to know what the “real” size difference is.

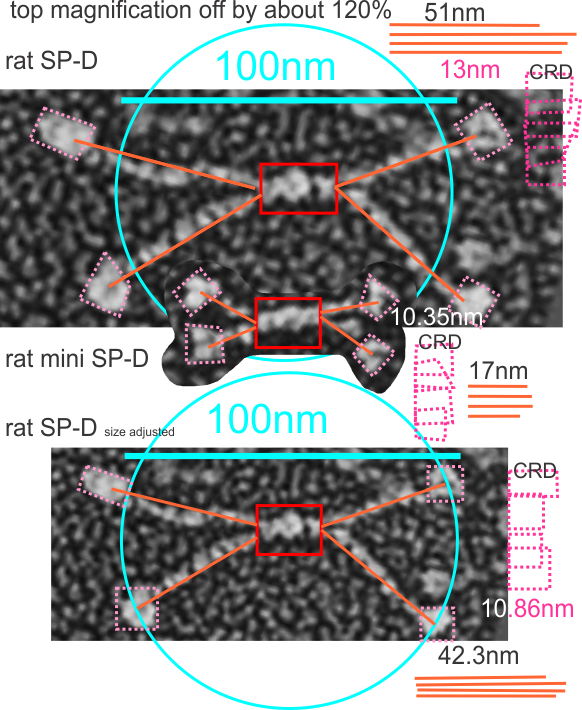
Here is an image using their own bar marker (green) and the diameter bar marker (peach), showing the relative decrease in arm length…..  This is a 72% decrease from the rat SP-D in their own micrograph, and an additional decrease when using the “other researchers” estimates of 100 nm SP-D molecules.

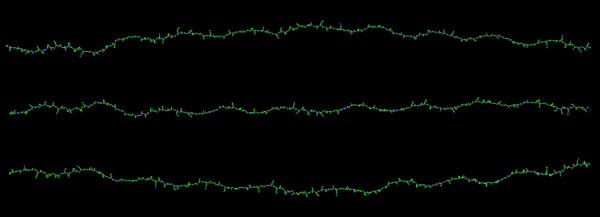
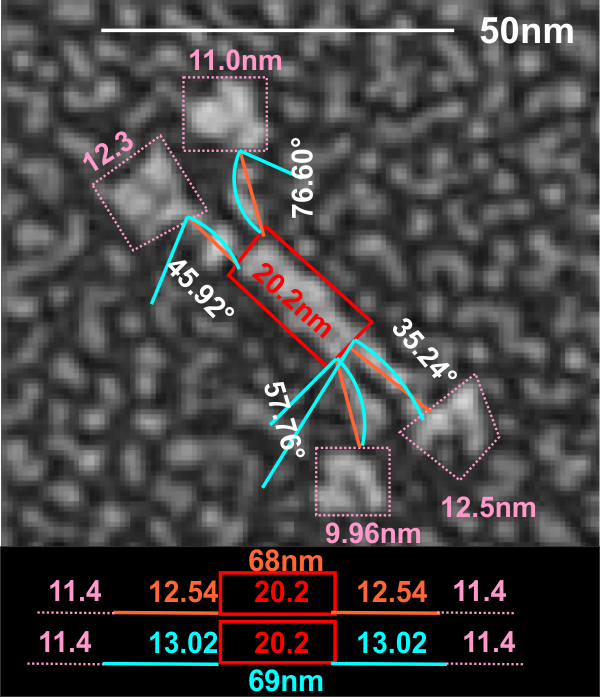
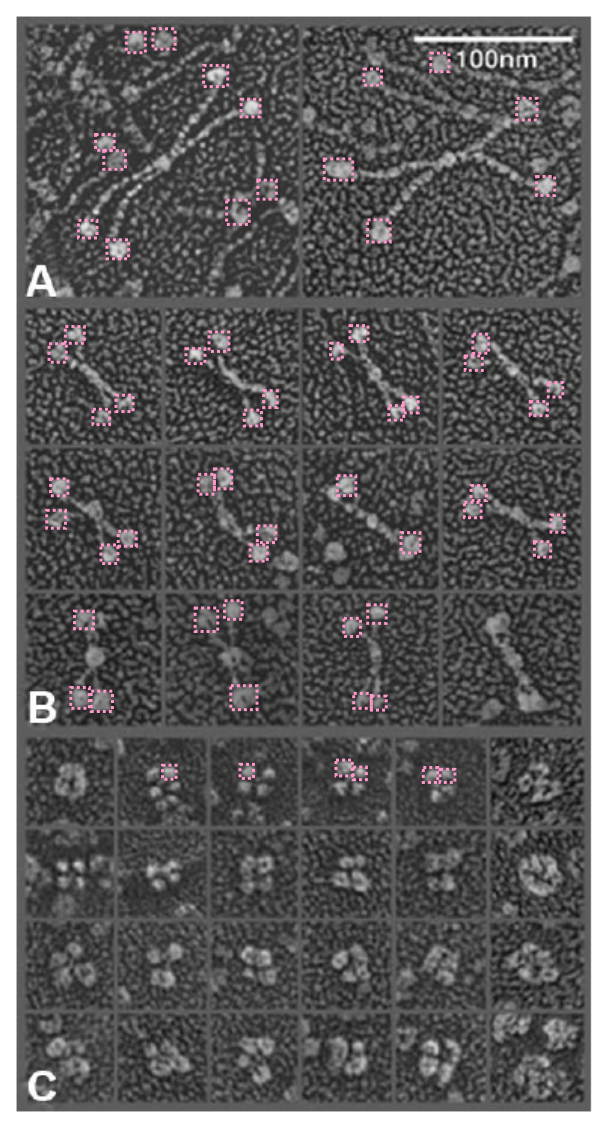
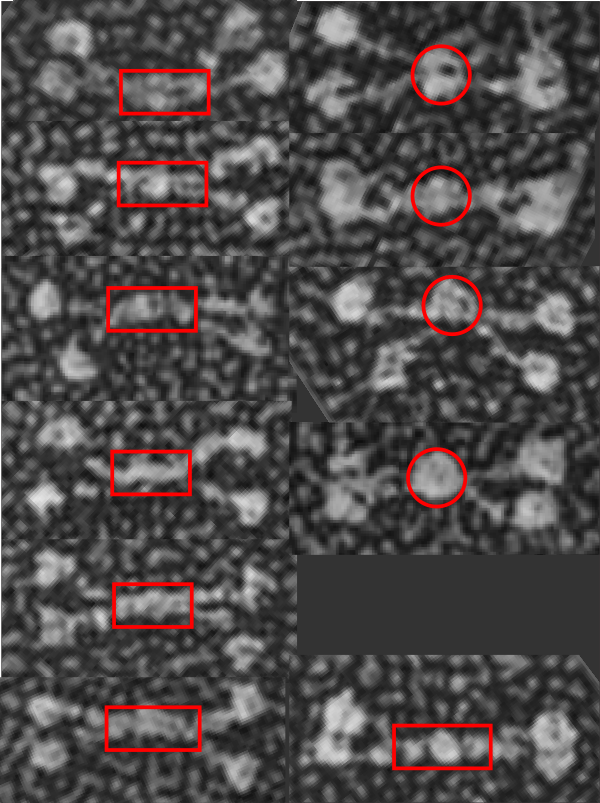
in trying to figure out the discrepancy in size of the molecules of SP-D in this publication i decided to do just a simple test: to take background images from the full SP-D  and the SP-D dodecamers with the collagen portion deletions and see if they were anything similar in texture.  So this also begs the question of differences in shadowing techniques on different grids…  so that could be part of the problem but here clearly there is no similarity in the size of the shadow particles in the top (rat full length SP-D molecules) and the so called mini_SP-D dodecamers.  This makes me think the full length SP-D is not the magnification reported. 
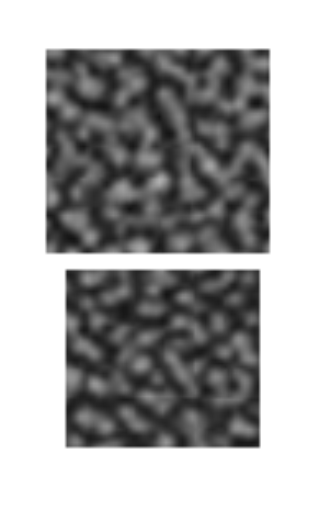
From E. Crouch, et al 1994   “SP-D revealed a highly homogeneous population of molecules characterized by four or more relatively rigid-appearing subunits, non-randomly arrayed about a central core. The core was only poorly defined as the center of interaction for the N-termini of the subunits. The subunits seemed to emanate from opposite sides of the core in pairs closely apposed over a distance of 10 nm from the center of the core. The results for paired subunits presented here correspond very well to the structure of SP-D observed in electron micrographs. Site-directed mutagenesis of Cys-15 and Cys-20 has shown the necessity for N-terminal cysteine residues to stabilize oligomerization, but the cysteine residues are not necessary for trimer formation. However, other results provide strong evidence for the existence of at least one intra-subunit disulphide bond within the N-terminal region after limited peptic digestion.It is possible that apposing pairs of SP-D subunits are associated in an overlapping anti-parallel arrangement restricting the spatial distribution of the subunits around the central core. Another hypothesis is the association of paired subunits end to end. Two subunits are disulphide-bonded between and within subunits, whereas the two (or more) opposing pairs of subunits are associated through an undefined molecule. It has not been possible to exclude the possibility of the contribution of other molecules in the assembly of several SP-D subunits. It is also likely that cross-link formation between two or four subunits involves previously unpaired cysteine residue, or that a process of rearrangement converts a specific subset of intra-subunit disulfide bonds to inner subunit bonds.”  this is good in a sense that when the centers of the fuzzyballs are examined, there is not an N-end to N-end “look” about the assembly.

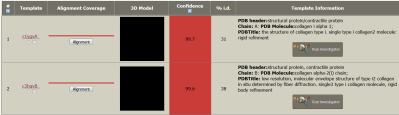
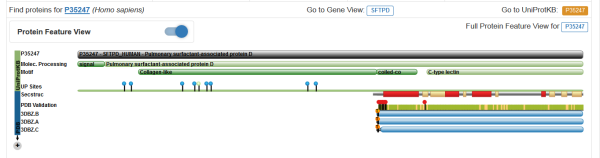
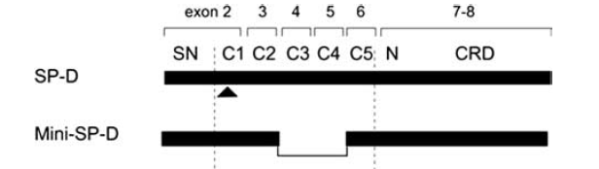
I am looking for the predicted length of the collagen-like domain with the C3 and C4 exons.