Monthly Archives: December 2018

Grey scale density maps of a couple SP-D dodecamers

This might end up providing clues as to where the center of the dodecamer divides the arms on the acute angles. It relies on a common point counting method in morphometry and the readings on grey scale measurements using imageJ. It will take some handwork, no question, if you know an more automated way. please advise.


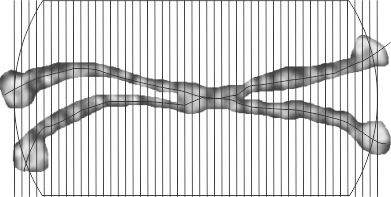
Another option worked on today is to cut the molecules and moving the parts into a straight line, then cutting a small band through the center where the variations in grey scale are found and using ImageJ to plot the grey scale values, setting up a plot in excel and using that under neath the visual.  I used photoshop at half transparency to put the right arms and left arms over each other and increasing the contrast of the two, then flattening the image and exporting a tiff to open in ImageJ.  The best rectangle through the dodecamer then is a blend of the two arms on the 45 degree angles (purposefully to see if there is a size and density pattern to the center part of the dodecamer that might shed light on how many of the amino acids in the collagen-like portion are involved there.

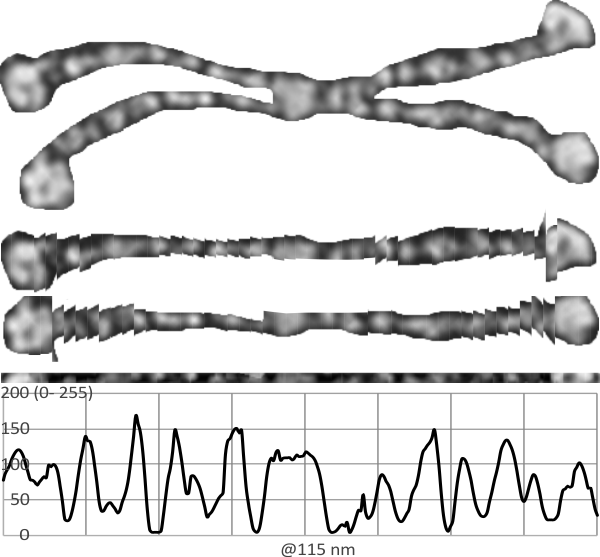
The same dodecamer as seen above, is the top image, then the “straightened image (i used about 25 cuts per arm) is shown for the two by two arms of the dodecamer below, and the blended half transparent flattened image is the the thin band just above the grey scale density plot.  Clearly there is a central area….matching that in the top image, it will take some additional images to find out whether the peaks along the arms are consistent or just random. One thing for sure, this plot does NOT show the definite bands that the image from Arroyo et al did.  I see that they used one particular image and this one i will test next.


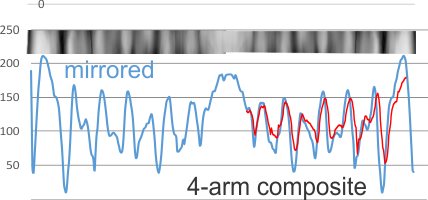
Adding to this is a sample from which all four arms are leveled out using corel draw and/or photoshop and aligned to a common length (CRD to N terminal) relative to each other, with two arms mirrored so that all CRD are pointing the same direction, each image overlay was taken to 80% or so transparency, the image flattened and a exported as a tiff and then opened in ImageJ for a grey-scale intensity plot. The two plots (upper one that is two arms blended in a dodecamer, and lower one, 4 arms blended and mirrorred) still give the impression that the peaks are related to the density of the particles shadowing the molecule. THe clearest differences are found in the size of the most central part of the N terminal and the outer globs of the CRD. It is possible that NO pattern can be determined from this approach.

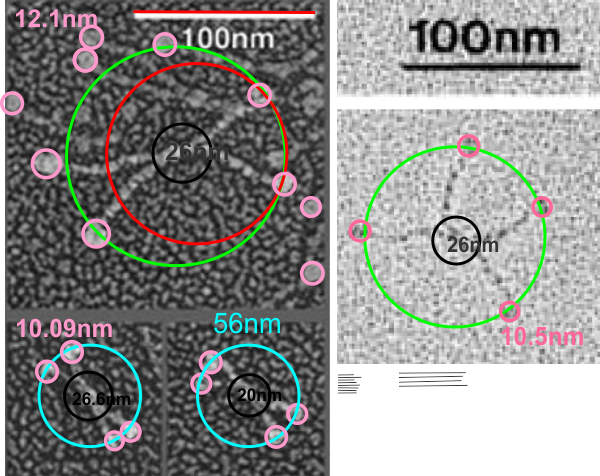
The best test for the background is to do some plots on areas that are adjacent to each of the molecules.

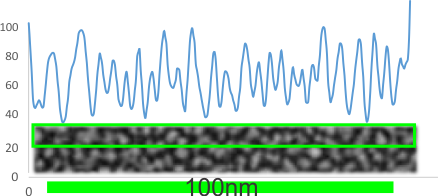
He is one such LUT plot for a background from the same group as is dodecamer above and the magnifications are relative to each other. The background has a 25 or 26 peak to peak distance in 100nm where the molecule that is shadowed has about 16, or about 5 in the images by Arroyo et al.  Neither is probably correct.  The peak height in the background is not the same as the dodecamers either, though images were not manipulated together, so that is another control to do.

What part of the collagen-like domain of SP-D forms the center with the N termal?

It is pretty obvious that the center of SP-D (at least as is represented in dozens and dozens of TEMs, and AFMs ) is longer in the direction of the 45 degree angle than the amino acid sequence would suggest and longer too than most diagrams present. There is a central dense region (which is found also on the tracing) but an extended region where two arms of the dodecamer are closely aligned with the combined length of something around 30nm, or a little less than a third of the entire length of the dodecamer.  The separation of the two arms on either end into the @45 degree angle  leaves the remainder of the arms as the collagen-like domain, and the neck and CRD on the order of 10-13nm the latter folded back upon the neck section to some degree. Tracing from Figure 2. Arroyo et al. JMB. 430, 1495-1509, 2018. Their measurement for the total width of a surfactant dodecamer seemed to be considerably larger than measured by others. So a compromise in estimated dimension has to be taken because of the differences in measurement accuracy and how much spreading of the molecules has occurred…  Relative measurements then, of 100 nm might be useful in determining the relative lengths of the segments of the dodecamer, but not the absolute lengths.

Normalizing the dodecamers to 100nm cutting centrally through at least two (probably best making it two polar) CRD is useful. A summary of the center (the highest, brightest (by TEM and AFM) areas of the SP-D dodecamer might be about


I would like to find a way to trace density of a curved line…. straight lines are no problem.  I think it is time to go back and measure these all one more time but setting density and width standards to get relative dimensions which at some point could be used for generalities describing proportions and regions involved in SP-D. s

SP-A and SP-D diagrams: these take the “cake”

Oh my goodness, how far from reality some illustrations, aka. scientific diagrams, are from the truth.  I do not understand how individuals who are supposed to “know” a topic, a “protein” a function of something like surfactant can use a ridiculous diagram like this and expect to gain any credibility whatsoever.  My gosh…. These diagrams have nothing at all to do with either SP-D or SP-A, they are fake news, provide conflicting understanding and do little to advance the knowledge of how proteins really look.  So sorry, but there is absolutely no excuse for this lack of understanding and depth of falsity.

I wonder if i could establish a monthly award for the dumbest scientific diagram ever seen.

Predicting moral behavior?

Matthew 25:21

Is it possible to predict an individuals overall moral behaviour by some of those every-day, not-too-critical, less-than-monumental activities?  There are laws and moral “rules” in my opinion.  Laws protect people from those who have a lessened sense of moral “rules”, at least this is what I am given to think.

NEW NEIGHBOR on on my street in  cincinnati ohio.

  1. sweeps leaves into the stormwater runoff opening (illegal)
  2. doesn’t pick up after his dog when he walks (illegal)
  3. puts food into the cardboard boxes set out for recycling (the latter I know because I saw a perfect size amazon (austensibly clean and tidy) box in and amongst the other boxes set out at the curb on recycling day, and took it home to use to mail things for christmas.  When i opened the box (which was deliberabely closed with the top weaved together) there were three huge portions of corn bread stuck in the paper padding. Not only a waste of food (at least the squirrels would have eaten it, maybe the deer), but also leaving the paper non-recyclable. While it is probably not common knowledge, it makes common sense, that paper that is greasy (like with cheese on pizza boxes) really causes recycling problems, this would be no exception.

Please advise. Would you trust any business dealings you make with someone who is willing to break ‘seemingly’ trivial laws and behave in a currently asocial manner. I wouldn’t, and I conclude that my obervation is NOT NEW, but recognized thousands of years ago as an indicator of morality.

Matthew 25:21 “His master replied, ‘Well done, good and faithful servant! You have been faithful with a few things; I will put you in charge of many things.”

Lost collagen domain length in mini-SP-D mutant

After figuring out that the images from one particular publication are between 15 and 20% larger than the micron marker accompanying the figure indicates, I went back to re-determine how much dodecamer arm length that the mini-SP-D lost when exons 3 and 4 were deleted from the collagen domain.  Again measuring the full SP-D in the micrograph and then using other images of SP-D and their respective bar markers I think that after several sets of measurements the miniSP-D has been reduced to about 35% of its original arm length. I am measuring the center portion (which surely contains more amino acids than just the N terminal) where it bifurcates.  Different sets of measurements sort of come in around 25 or 6 nm. The CRD are pretty close, and measurements indicate that the top left figure (which is the one which has the out of sorts micron marker (indicated by the different measurements for the diameter of the  underlying SP-D dodecamer… the red circle being what was given as 100nm (clearly too short) and the green circle indicating a diameter that would intersect the CRD in 3 different locations (typically I have used intersection of 2, but this one has three by chance) and is a much more accurate indicator of a 100nm.  Using the later, the center is N term plus whatever of the collagen portion is associatiated) is about 26 hm..  in the full length AND the mini-SP-D  so this suggests that the measurements are more in line, and also that the central X of the dodecamer hasn’t changed much with the deletion of the C3 and C4 regions.   Bars used to measure the arm length are the thin black lines in the lower right.


I am not putting these numbers out as anything but approximate, but they are similar to earlier posts, and a general indication of size.

One thing that is kind of interesting to me is that the collagen-like domain is often referred to as “disorganized” and often referred to as “braided” or like the helix of collagen.  There really should not be much discussion on whether it is organized or not… haha…  just looking at the pictures.


Determining the “middle” of the SP-D fuzzyball or dodecamer

Obviously in real space, something as flexible and dimensional as one of the c-type lectins, with their wound arms and heavy carbohydrate recognition domains, would fall onto TEM grid in various positions, so finding the “perfect” micrograph of the molecule is not going to happen.  So determining what tethers the N terminal and parts of the collagen domain are quite related to the subjective interpretation of each individual molecule that one sees.  The arc of the arms, the area of the CRDs, the angle of the separation of the individual arms……all just interpretation.  Because it is a matter of judgement, estimates of the number of amino acides in the collagen like domain that are held together in the central (seemingly more rigid) portion of the dodecamers (and fuzzyballs) varies from micrograph to micrograph, and is more apparently different when the SP-D has been “modified” by the loss of some of its length (as in the mini-SP-D developed by White et al (The Journal of Immunology, 2008, 181: 7936–7943).

These particular measurements show something like 30% of the collagen like domain is taken up in the straight-bar part of the center of the dodecamer.  This might be close..

Just visually and with the marked sites on RCSB i would bet these aa are part of the N term contriution to the center line in SP-D. Purple – signal peptide, [MLLFLLSALVLLTQPLGYLEAEMKTYSHRTMPSACTLVMCSSVES] and these are the AA in the collagen like domain which may contribute to the rigidity of the center portion of SP-D dodecamers and fuzzyballs [GLPGRDGRDGREGPRGEKGDPGLPGAAGQAGMPGQAGPVGPKGDNGSVGEPGPK]

Domains of SP-D and correlations with micrographs

A breakdown of why i think the collagen portion of SP-D is involved in the central area.  The ineup on RCSB shows each AA of SP-D and interesting points along the early part of the collagen like domain which lie pretty much in a line with the point where the arms of the SP-D dodecamers branch.  Also the length of the AA sequence (which hopefully is more or less relative in size for the straight-ish trimer arms and the coiled coil neck, but it is easy to see that it is quite a bit truncated, thicker, and rounded at the  CRD end (and therefore shorter). Red is a list of AA of the Nterminal, black is list of the AA of the collagen-like domain, green is AA list of the neck, and blue is AA list of the CRD.  It is easy to see that the 50 nm (half the 100 nm that is typically used as the measure of an SP-D dodecamer, is not quite enough here.  This might be just because of variation in how this particular molecule is splayed out, or it may be a variation in the attributed 100nm bar marker provided by the author, or SP-D may actually be just a little larger than 100nm.  But what is pretty clear is that there is some of the first part of the collagen like domain that is connected, as a continuation of the center beyond what the AAs for the N terminal would suggest.


Image links to the page of the RCSB that I have screen printed here. And the diagram of the collagen-like portion is a figure from Sorensen, G Frontiers in Medicine 2018.

Find the difference: SP-D

Looking at the RCSB structure diagrams for SP-D and a mutant SP-D described by Goh, et al, released 2013, boy I can not see the difference in the structures. The SP-D top three views (human SP-D) look identical (i rotated it ever so slightly to make sure all the residues cold be seen) to that modeled for two mutations, (ref and mutation sites noted in the image).  Please do tell why this SP-D which doesn’t appear to be any different than the views above would bind influenza A virus so much better than the wt neck and carbohydrate recognition domain.  The NCRD protein is viewed from the top… presumably where the trimeric structure should connect with the carbohydrates on the virus?