Monthly Archives: May 2019

ALL GENDER RESTROOM

What the h**L is an “all gender” restroom. As far as i remember there are only two genders, anything else is fabricated. The two genders include all genders encoded by our DNA  – regardless of how fragile it is, how much it jumps, or how it gets diced, deleted, CRISPR’d, rearranged, inserted, STOP’d, excised, SNP’s or modified — biologically  its still just XO XX, XY, XYY, XXY, (I dont think YO is viable) and that is likely to stay the same regardless of how you move it, remove it, or put it to work. So whats this sign about??

I prefer this one which still takes into account that we are X and Y assortments, and that some need help (infants and those who are disabled in some way) but without making jokes or being condescending.

Porcine SP-D dodecamer

I found this article by Martin van Eijk et al which had rotary shadowed images of surfactant protein D.  One of these (which might be a dodecamer…with perhaps one of the trimers (on the left of the image) that is a little unwound? perhaps, or it also may be a structure with more than the four trimers of a dodecamer) but it has a small center area which presumably might indicate a different type of N terminus binding than human SP-D.  I would like to find AFM images of porcine SP-D to compare since this image (shadowed) and AFM produce such different views of SP-D that they are not comparable.

It will be fun to count the arms on the fuzzyballs in this image.  It appears that the porcine SP-D dodecamer (which i have measured as the diameter of a circle (dotted red line) that intersects the CRD) is just over 100nm, actually about 110nm according to their bar marker (red below). The ratio of CRD to length and width of the arms of the collagen-like and N terminus domains “looks” at first glance to be similar to hSP-D.

Center low brightness (lightness) area in SP-D fuzzyballs (between the Ntermini ?)

The dark area here in a fuzzy ball (not my AFM image, someone elses) shows a consistent 6-8 nm dark center…. between the N terminus peaks.  Both arms (as best as I was able to stretch them from the CRD across the fuzzyball (which may not be at all accurate, and i think is NOT accurate but used for now) the center is vacant.  or at least it has a valley in the LUT tables that is nearly as low as the valley before peak 1, 2, and 3 begin on the left and right halves of the molecule.  I think it is more likely that two trimers bend into a U shape and are connected somehow side to side.  I will continue to measure the arms as separate entities.

On the surface this might seem like a thankless task but i could be a valuable lesson in how collectins link together to make multimers.  Side to side links at the N termini in SP-A and MBP and other c-type lectins makes it very likely, more likely in fact because of images like that below, than any other arrangement.

SP-D fuzzyball 1 monomer arm 2

Measuring here the second arm of a 14-arm SP-D fuzzyball to determine whether the pattern of LUT plots made from each arm match up the plots for the dodecamers. There is clear pattern to the latter, and seems from two LUT plot sets to be true for the fuzzyball. The problem arises from the discrepancy between the dodecamers and the central area of the fuzzyball which seems to be more like a ring than a huge accumulation of N termini.

Little changes in LUT plots with manipulation of original SP-D images

Well, it seems pretty clear that the LUT plots gathered in ImageJ really are not affected much by the manipulation and scrambling around to make them readable in a program that doesn’t have a lot of line drawing flexibility.  I am convinced that the smallest amount of care will produce quite repeatable results in the LUT plots.  These images are photoshopped, cut, centered, rotated, saved and resaved as RGB or BW images, and the plots don’t really get too different, one to the other. This is good news i guess, hopefully it will be useful to someone studying SP-D
ON THIS HALF arm of a multimeric molecule (n=14) it still looks like the N terminus (left and a portion of the N terminus ring in fuzzyballs) will be the tallest peak (whitest – brightest – most luminous – lightest —still looking for that word to describe the digital whiteness) at or around 240 on the scale of 1-256. After that a close by and very consistent tall but not too wide peak, then possibly 2 or 3 small peaks and finally the carbohydrate recognition domain (not as high a peak as found for this domain – (whitest – brightest – most luminous – lightest level for the multi-lobed CRD).  Bottom two images of SP-D are photoshop images and NOT REAL., Modeled however after the top three images are of one arm which came from a single fuzzyball. (fuzzyball 1 arm 1)


IS THIS Luminance? or LIGHTNESS? how to define 1-256 in terms of atomic force micrographs

Luminance: This is a basic question – that is how to define (label and measure) the brightness or luminance or luminousness of the various greyscale portions of micrographs. This is a question for morphometry – presumably outside the image and photograph world?

Various definitions, interpretations, ideas, statements are given freely on the internet — but how does one really define the brightness – or height of bright areas defining molecular structures in the digital signature of atomic force micrographs.  I am looking for some reasonable way to quantify the brightness (in terms of grayscale pixels with a 0 – 256 level) of images of surfactant protein D. (these fun images show luminance and chrominance). It will be the pervue of artificial intelligence (as the technology becomes suitable for scanning large numbers of microscopic fields and “learning” how to classify organelles and molecules.

1. Here we have one definition: Luminance is then a simple function of the number of photons of the specific wavelength interval (corresponding to red, green, or blue) that the pixel receives This means that color is obtained by merging the luminance values from adjacent pixels using computational algorithms, in a process that is called compositing (Fig. 5.2). I am considering this irrelevant to greyscale.

2. And another definition: To measure the total radiation, which includes both reflection and emission of an area receiver, a photometric measure called the luminance is used…. in the same URL, also to quantification of greyscale in micrographs.

3. And from an additional article from science direct: Luminance and Contrast —Luminance is defined as the intensity of light from the visible spectrum per unit area traveling in a given direction (usually expressed in candelas/meter2 [cd/m2]). I dont really like this definition for greyscale either since i don’t see anything traveling in any direction (haha).

4. And a very simple definition: the state or quality of being luminous. Also called luminosity. The quality or condition of radiating or reflecting light: the blinding luminance of the sun. Optics:the quantitative measure of brightness of a light source or an illuminated surface. The brightness might also be called lightness. If the definition of HSL is as follows:

Hue is a degree on the color wheel from 0 to 360. 0 is red, 120 is green, 240 is blue.
Saturation

Saturation is a percentage value; 0% means a shade of gray and 100% is the full color.
Lightness

Lightness is also a percentage; 0% is black, 100% is white.
The only adjustment here is that greyscale of 0-256 would have to be converted into percent black being 0 and 256 bing 100%. This actually might be a good way to control for the difference in contrast in different micrographs. I will give this some tests…. because it occurs to me that when I plot the LUT using Image J one would be advised to fix a given beginning and end, maybe a small gradient map to each plot to the allow that the different in contrast to be normalized.

5. And from Google: Luminance is a photometric measure of the luminous intensity per unit area of light travelling in a given direction. It describes the amount of light that passes through, is emitted or reflected from a particular area, and falls within a given solid angle. The SI unit for luminance is candela per square metre (cd/m2) — also clearly irrelevant to finding an internal standard and name for greyscale plots.

So in a sense the luminance (which I have assigned to a scale of 0 – 256) would be a digital value of the amount of light reflected “reflected” in quotes, and registered by ImageJ in an arbitrary scale. Further, since there is no color in these images (converted to greyscale by me sometimes, and sometimes by the authors of the publications), then “chrominance” ,which apparently is a real word,  does not apply, and luminance is just a matter of “brightness”.  The use of what is currently in the literature would possible be HSL. Hue, saturation and lightness.

6. and who knew Brightness was subjective: and i quote “Luminance is the luminous intensity, projected on a given area and direction. … Brightness is a subjective attribute of light

7. This group has chosen to use a second descriptor: luminance factor. [′lü·mə·nəns ‚fak·tər] (optics) The ratio of the luminance of a body when illuminated and observed under certain conditions to that of a perfect diffuser under the same conditions.

8. so perhaps Luminousness is a better term. Luminous has a very simple definigion — means full of or giving off light: suggesting here the words “digital luminousness” haha… perhaps that is too hard to say fast, many times in succession.

So one must conclude that some qualifier of the word luminance is what needs to used when describing the relative “lightness” or “brightness” in greyscale in morphometrics of organelles and objects in a micrograph.

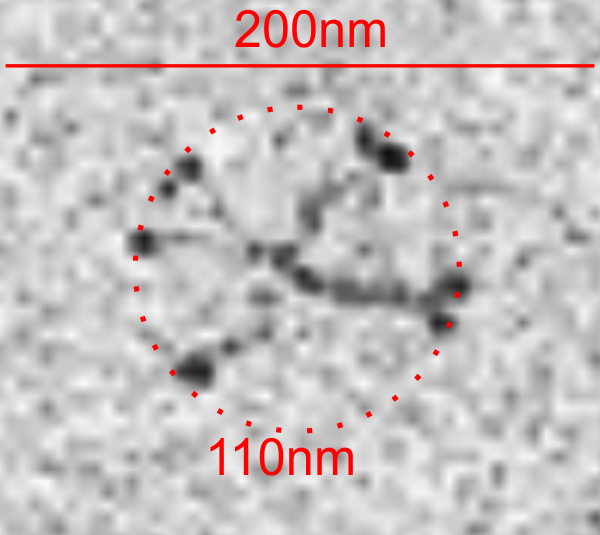
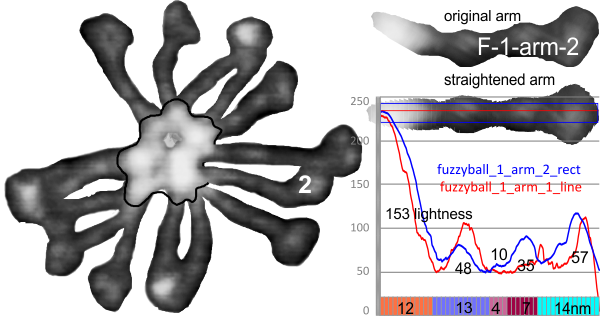
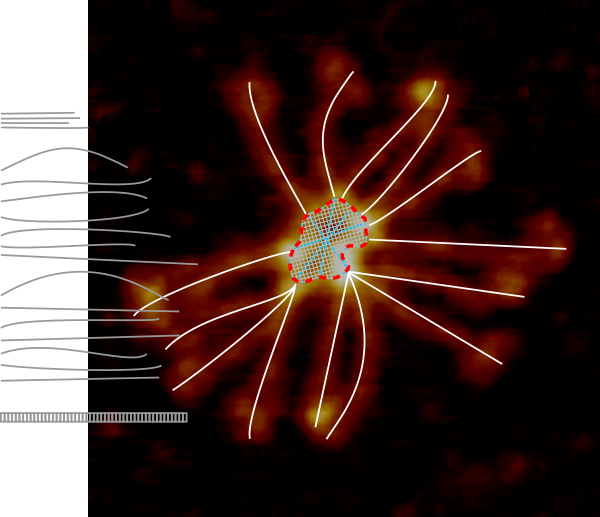
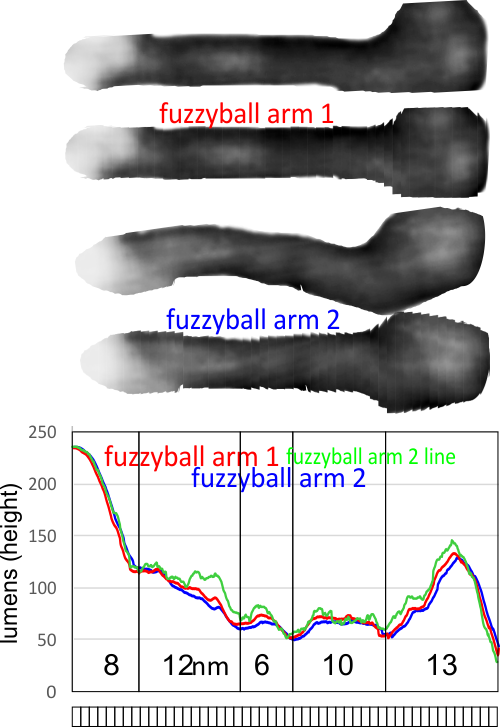
This plot (below) then is an attempt to find a way to quantify tip height in AFM, and uses greyscale to do so, and also nm as a measure of length of the monomer.  If you begin at the red area and see that it is about 14nm in width and total of 193luminance points in height it represents the center of the SP-D dodecamer, the N terminus (here just one side of the two that come together to form the dodecamer  (only one monomer shown in this plot> Thereafter there are three or four (more often just 3) smaller peaks (a peak defined as a minimum distance from peak to valley of 9 luminance points (0-256) and then on to the last peak with is the carbohydrate recognition domain.  The plot below is a summary peak-ness of the trimeric unit that makes up an SP-D dodecamer.

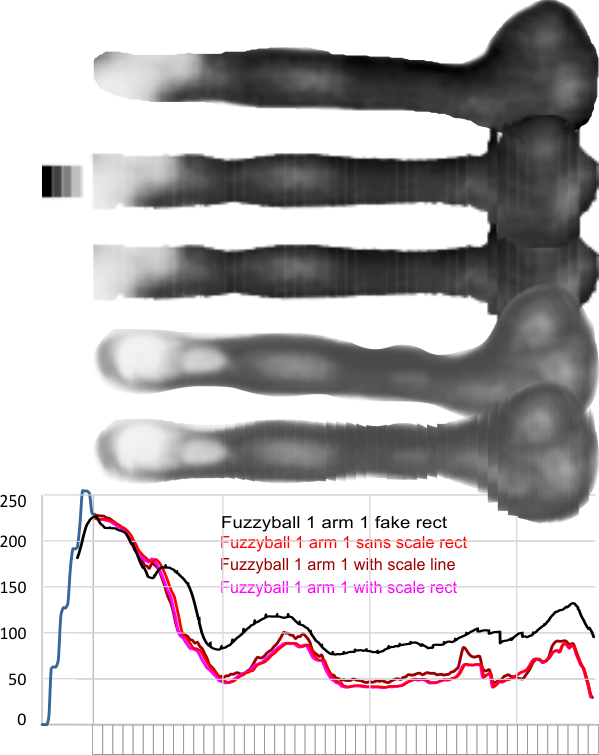
I think i will try to use a square (17×17 px) greyscale standard at the beginning of all the LUT plots that i do, then in excel i can use the internal control numbers to try to control for variations in greyscale (contrast and lightness) in micrographs.

Center ring in SP-D fuzzyball multimers

Revisiting an interesting idea (at least it interests me) is why there is a center in the surfactant protein D fuzzyball that has such an large “central gap”. After having plotted the luminance peaks (height) on a half dozen SP-D dodecamers I decided to approach the arms of a fuzzyball in a backwards manner, that is to measure it from the carbohydrate domain inward towards the N terminal domain and see whether the length and peaks along those arms were at all similar. The first fuzzyball that I measured (that is the first two arms of the first fuzzyball) had similar peaks, N terminal being the highest point at about 240 lumens (1-256 grey scale that measures the height of AFM images) and each peak (normalized to half a dodecamer (that is 50 microns) has similar numbers of nm accounted for in each of the typically 5 — not always — peaks from N terminus to CRD.

Top image — original from someone’s publication, two converted to greyscale and trimmed and one lightened in contrast to show the peaks, and bottom right, colored according the brightness, pink is the highest points measured, corresponding to the N terminus peaks and as seen in LUT plots of SP-D dodecamers.
While I have not gone back to the original publications to measure the size of fuzzyballs (averaging CRD to CRD measurements as diameters, with the published micron markers I do know that the micron markers are poor indicators of what the actual magnification is… just sloppy measurements or perhaps real differences in size, but these are not my images so i don’t know. But I am assuming that the fuzzyball arms are not different in terms of AA sequence, and because they plot the same shape in luminance as do dodecamers, I am assuming that fuzzyball SP-D arms are a similar length (that would be @50 microns from N terminus to CRD)

Image below shows the fuzzyball analyzed, with 14 (though i acknowledge that one arm might actually be overlying a 15th arm… hard to tell) with a mean length (calculated according to the LUT tables and plot curves as mentioned from the CRD to the N terminus peak) a distance of about 22nm. This distance is actually as prominent (and long) as any measured peak in a single arm. In the image below you also see curved arms (which i did not use arc angle length calculations to straighten but just ysed linear distance which underestimates length. (i could do that but didn’t make the time to do so and even with curves underestimating length the mean was 44nm +/- 4nm and the remaining nm would not account for the center empty space in the fuzzyball which was anyway.  Average diameter of the central dark area (covered here by the sqnm grid) is 22nm+/-2nm. The square nm of the empty space is about 300. grid beneath arm measures = 50nm width.
LUT plots for two arms (both on the right hand side of the first image) cut into 1nm slices, centered and plotted by either a rectangle or line in ImageJ are shown at bottom.

The bottom line of this post is that the N termini of SP-D are probably joined NOT end to end in a fuzzyball like they are in the dodecamers, but side to side. Why would they be different?

Unseen cost of construction of the Health Sciences Building at Univ. Cincinnati

There is an untold cost to the construction of this 61 million dollar facility.
1) Visual — metal cap to the old Physiology Department for the Old College of Medicine building just looks like someone did a really inexpensive sloppy job of making a new “front” to the historic, brick, and nice old building.
2) Tons of wasted space in the spear style architecture for the new building… good grief. If more space was an issue (which it really wasn’t, as I walk down the hallway to see empty offices in the old building) then this didn’t really accomplish what it might have. Not really usable space, ugly metal really is tasteless (almost as tasteless as the Vontz) spear looking thing…all glass (going to cost plenty to cool the interior of this building).
3) Metal addition to the entry way to Kettering (the Department of Environmental Health) does a poor job of connecting the vertical metal pointy architecture of the new Health Sciences Building with the old…
4) BUT THE REAL issue is the number of lost man hours of faculty, student, and staff as we walk half a mile around Messer Construction companies barricades (which twice upon query blamed on UC regulations). You can be sure that those extra minutes of walking and waiting for trucks to load and unload come out of UC time, not the employees time. ha ha… serves you right UC… when business and show, and not students and faculty, are a priority…. you will lose.

Lysosomes: a few interesting facts

1. Lysosomes are known to contain more than 60 different enzymes
2. Have more than 50 membrane proteins: Hydrolytic enzymes, including proteases, nucleases, glycosidases, lipases, phospholipases, phosphatases, and sulfatases
3. Produced by RER via golgi then small vesicles
4. A mannose 6-phosphate is a sorting signal specifically tagging proteins for lysosomes
5. Lysosomes are very heterogeneous (amen….considering those in liver cells containing perflurochemical emulsion particles)

Thinking about Dr. Seuss

Dr. Seuss portrayed a brilliant philosophy on many topics. I marveled the other day at his insight. His drawings of animals and people were not my favorite types of characters – no big eyes and darling smiles, NO, I surmise that he deliberately made many of his characters without 1) gender 2) race 3) beauty 4) and seemingly deliberately made them kind of “ugly”.  A perfectly wonderful tactic to remove those social triggers from his books, giving the parents and kids to reflect on his philosophical statements without their own bias, feelings of discrimination, and reverse discrimination.

He used minimal colors….. not making the few people he drew as having a “color”, no big noses, no almond eyes, no curly hair, no blonds.  While it was expensive to reproduce color images in the era of his books, this too was a good way to avoid his real messages from being mired in the muck of prejudice and supremacy and discrimination and religious and cultural and gender biases.

He was a gifted communicator, brilliant.

So i have redone one of his masterpieces…. ha ha..  in the vulgarities and profanities of today.

“It’s a crappy-ass world
and all the nut-cases in it
are mired in muck
every “effin” minute
I’m breathing relieved
believe it or not
for the wakos and stink holes
I’m lucky I’m not.”

When i googled early cartoons of his i was a little dismayed to learn that he worked for Standard Oil Company making adds for their Flit, chemical insecticide spray. This may have been one of the reasons that his later books had environmentally relevant topics.  (formulation contained 5% DDT in the late 1940s and early 1950s, before the negative environmental impact of DDT was widely understood.)  We may come to our senses, as apprently he did, later in life.

Then comes this post….. yes, we all start out somewhere.
This was indeed a time when technology was alloed to maime and kill indiscriminately (and discriminately), research was done on live human beings and nuclear power was thought to be harmeless. So here is a quote from that link —
“But Geisel, like all artists, had to start somewhere. Eric Carle, who created 1969’s “The Very Hungry Caterpillar,” joined the children’s book world only after author Bill Martin, Jr., reached out him, impressed by a clever lobster illustration from his Chlor-Trimeton allergy tab adverting series. Shel Silverstein worked for decades as a “Playboy” magazine cartoonist before he published his beloved G-rated rhymes for children in 1974’s “Where the Sidewalk Ends.””

The bottom line, again, speaks to a man who was thoughtful, perhaps ignorant of chemical carcinogens and pollution in the beginning, began speaking agains racism, inequity, beaurocracy, and environment.

“…as time went on and these things became known, he changed…”

I see my changes in the last 75 years, similarly.