The obvious answer is yes, but it is not too clear still whether the plots of rotary shadowed type 1 collagen and the collagen-like domain of SP-D can be used to determine peaks and valleys along the relative paths of each, respectively.
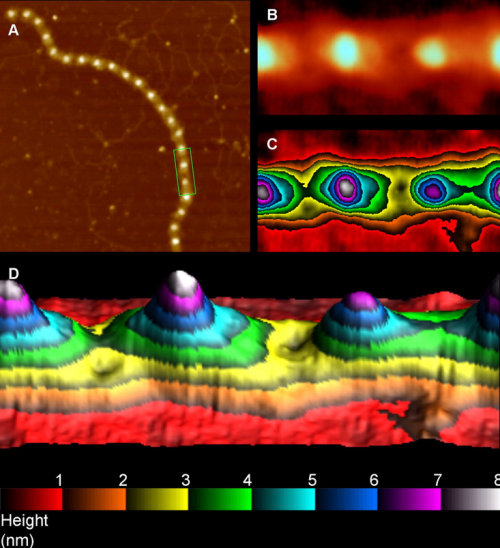
SP-D has some unique characteristics which show up pretty well with AFM but there are apparently not a lot of images for “share” to get sufficient statistical information on how the width and height of the peaks along the SP-D dodecamers line up with similar sequences in other proteins.
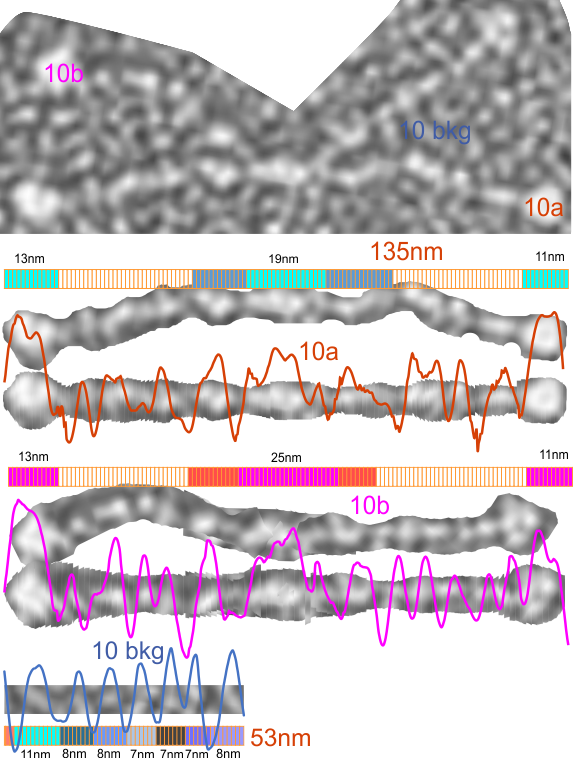
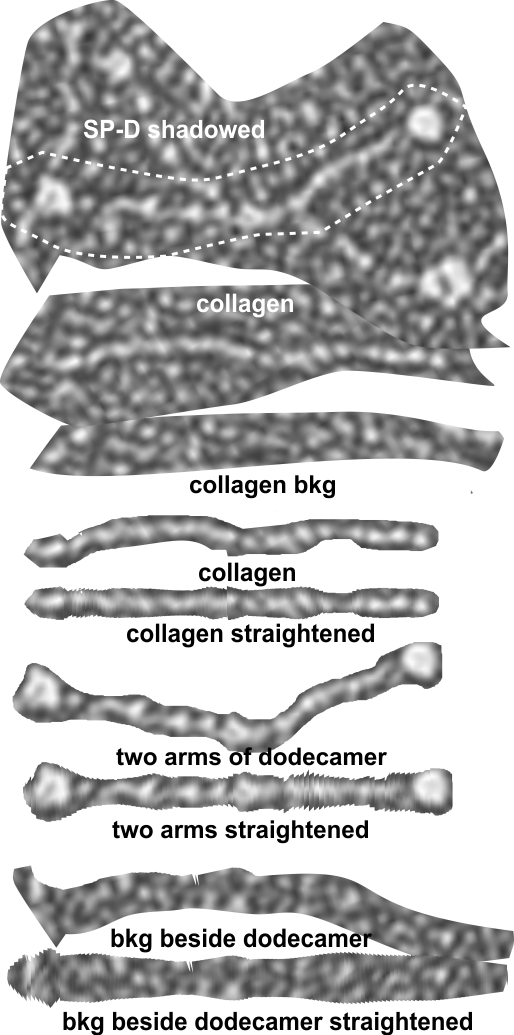
There are quite a few rotary shadowed images of SP-D (particularly dodecamers) that have been published and there are some obvious, and not so obvious areas of similar organization that is seen with AFM). So I am trying to figure out whether these data can be used along with the AFM measurements to come up with some relevant anatomical points along the SP-D molecule, especially the collagen-like domain. Some years back there was an article that showed SP-D (dodecamers mostly) shadowed along with type 1 collagen molecules. I have used these images initially to see whether the shadowing of the background is too coarse to allow accurate measures of the the smaller (less than 10nm) bright (light – high) areas to correlate with those seen with AFM. Below is the original image from which a hexamer (from a dodecamer) has been cropped out, and a collagen molecule has also been cropped out along with their adjacent “background” shadowing. When needed the molecules have been straightened and aligned to the 135nm diameter that the dodecamers seems most likely to be…and LUT plots determined. (TOP image)
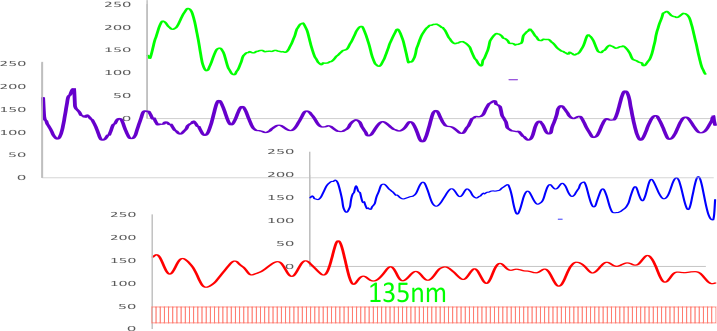
The image below is the LUT plot summary (blogged yesterday without the images and nm measures). ONLY the SP-D dodecamer has peaks around or above 200 (brightness – presumably relating to peak height), all other peaks are less (green plot is end to end (2) trimers of SP-D) and red fill is in areas above 200 – in a grayscale of 0-255). They are, not coincidentally, the positions of the N termini joining at the center of the dodecamer and the CRD at either ends…. a perfectly obvious fact. Collagen itself did not have any peak heights (brightnesses) which were above 200. Similarly, backgrounds adjacent to the SP-D and the collagen do not show peaks above 200. The collagen-like domain peaks in AFM are somewhat similar to the collagen LUT tables below, and only a few peaks seen in AFM of the collagen-like domain reach the brightness of the N termini or the CRD. In a sense, this is supportive of the fact that shadowed images can provide similar results to AFM images of SP-D. What has to be determined is what impact specific AA sequences have in the peak/valley plots of the collagen-like domain (as similar peaks to show up with AFM) that are different than the shadowing of type 1 collagen used by Crouch et al.