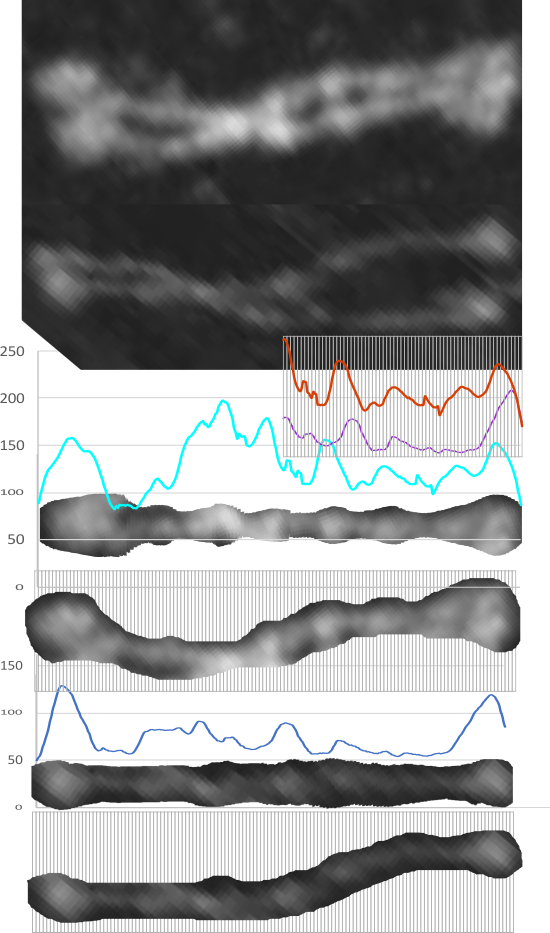
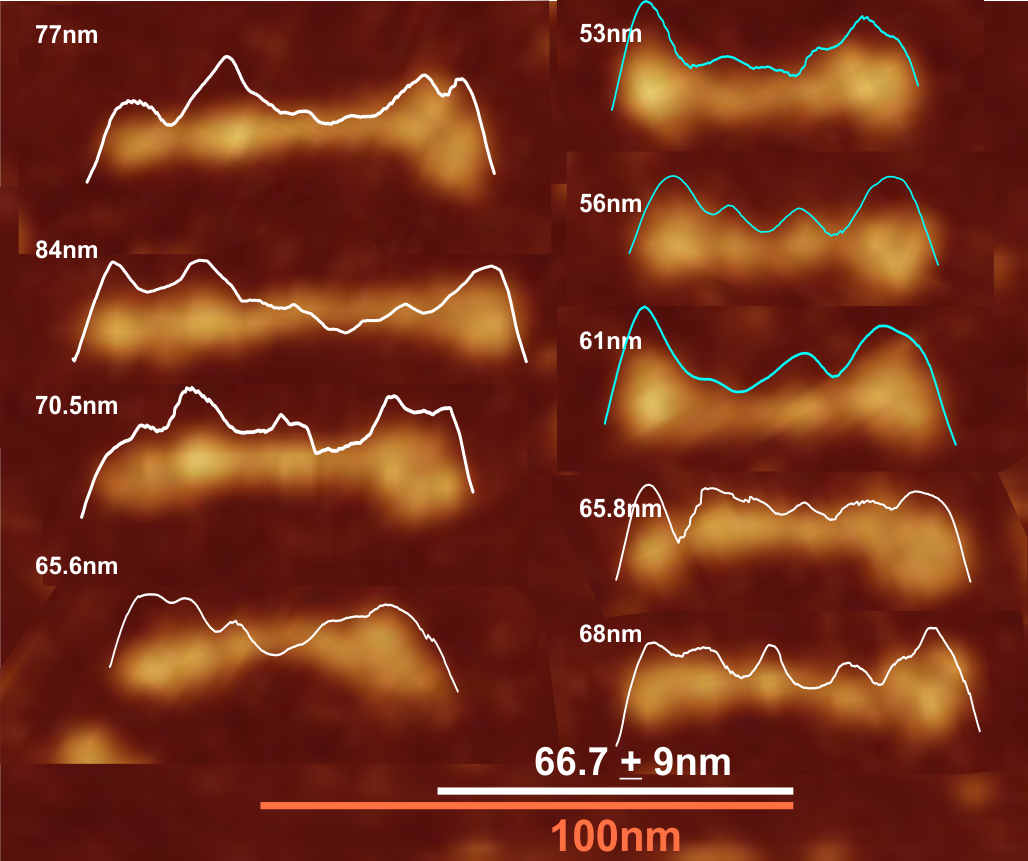
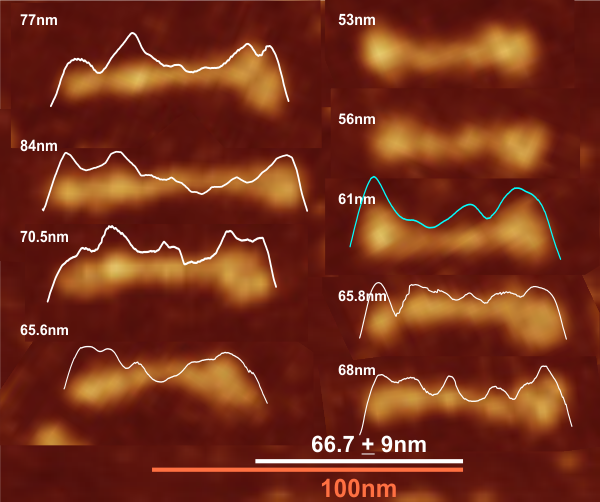
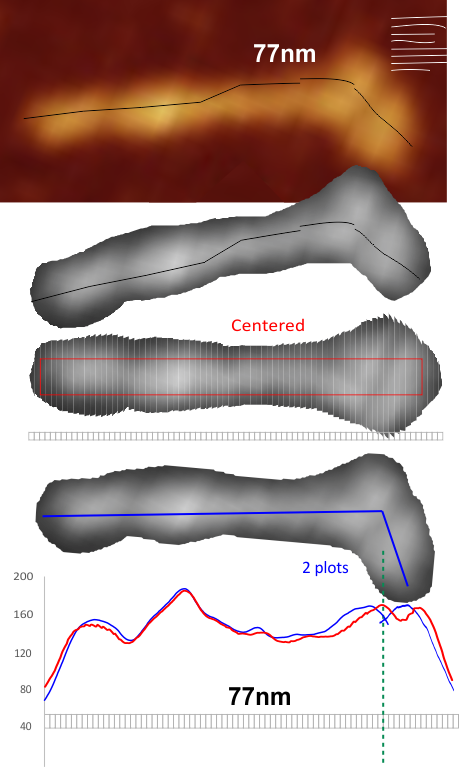
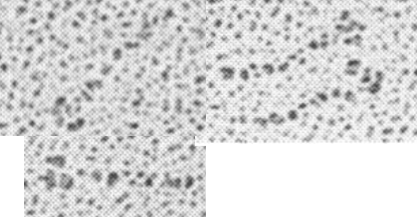
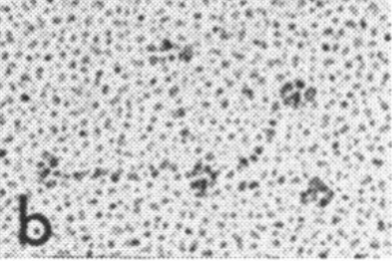
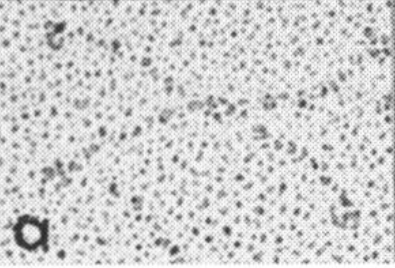
Comparison of LUT plots for dodecamers of SP-D seemed like a worthwhile test before going further on measuring the multimers and the trimers and the hexamers for peaks and valleys in grayscale.
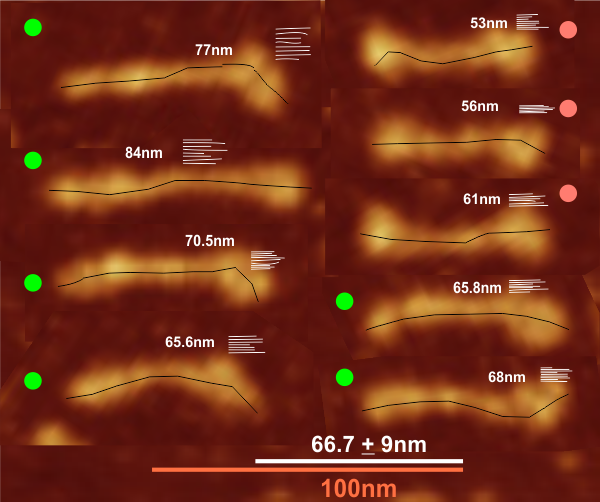
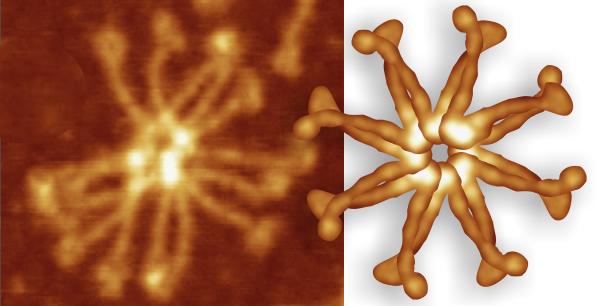
So i picked on of the dodecamers that I though was clean and informative from a higher mag AFMicrograph and compared it at the same (as best as i could from the measurements on posted images (low res image coming from Hartshorn et al, 2008) to see whether the fuzzier and lower contrast image would produce the two main peaks plus three intermediate peaks in each arm of the dodecamer. (main central peak is combined from the Ntermini of two trimers or 4 trimers or many trimers in a fuzzyball – i don’t think it is certain yet whether the multimers are made of just hexamers or dodecamers or both).
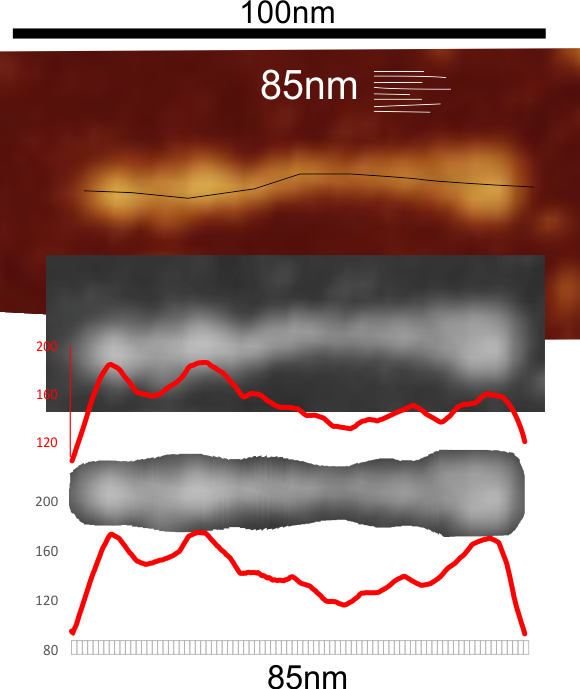
But as you can see from LUT plots (using ImageJ) isolated straightened arms of these two dodecamers can be easily seen as pretty similar. The one from the higher mag image is much nicer, but data are still present in the low mag image. So that is kind of nice since i can still use those to add to the dataset on positions and incidence of intermediate LUT peaks between the Ntermini and CRD.
Plots adjusted for half width are just under the copies of the two AFMicrographs…. best res on top, lowest res on bottom of that top image. and beneath that the adjusted best half LUT plot for each orange and purple respectively. The first peak in the collagen-like domain is very very constant, also prominent. Staggered connections (as would be the Ntermini) are common in biology, especially the structural proteins.
