Monthly Archives: May 2021

GIMP for processing AFM images – unsharp mask

There is a dilemma for researchers in terms of their choice of image processing programs.  The industry giants charge considerable amounts (matlab is exorbitant), what used to be high prices for CDs but now for online subscriptions.  Does the US taxpayer need to pay for these services – it doesn’t seem quite right that we pay industry graphics prices to do science which benefits all of humanity (hopefully).

I have spent the better part of the year (not full time but avidly) trying to figure out who has the image processing program that is the easiest to use (i am talking here about real ease of use…. as I come to this field as a visual learner, without apologies, but find much lacking in the so called “intuitiveness” of many programs). I am also interested in the least expensive program as i dont want to feed the giants in the commercial world.  Another goal is to see whether all the bells and whistles that are touted in the new image processing programs really make a difference for scientists who are wanting to do some relatively simple things….  get rid of dirt, get rid of pixels, identify and enhance hard to see details, to put statistics ahead of guessing about shapes, peaks and the like.

I began 50 years ago with wet-darkroom prints, and the simplest tablet and stylus, haha i don’t even remember the name of the setup but could look that up in a materials and methods published somewhere.  I used camera lucidas and pencil, then digital images.  The earliest processing was just a hand waving  (dodging and burning) then using those same terminologies, photoshop appears.

The earliest plates for publication were made on matboard with a drymount press and tissue.  The earliest program that i used for making images into figures was the first version of CorelDRAW (it was version 3) cracked on 11 pink 3.25 inch floppy discs.  These were mostly plots and line drawings.

50 years later, I still use CorelDRAW (x5 and 19), CorelDRAW Photopaint (x5 and 19) and still use Photoshop (6 and 2021), and have in the past year examined ImageJ, Gwyddion, and GIMP.  It is difficult not to be biased because CorelDRAW has had both raster and vector elements that in my way of thinking are more than adequate for both processing images, measuring features, and creating diagrams. CorelDRAW has been nicely compatible with Photoshop and Illustrator (though the reverse has never been as smooth). I have used images with 100 layers or more imported into CorelDRAW from Photoshop with ease.

So the purpose of this is to determine whether it is possible to do image processing with the same filters and measuring options in the open source software as is done with the high priced industry standards.

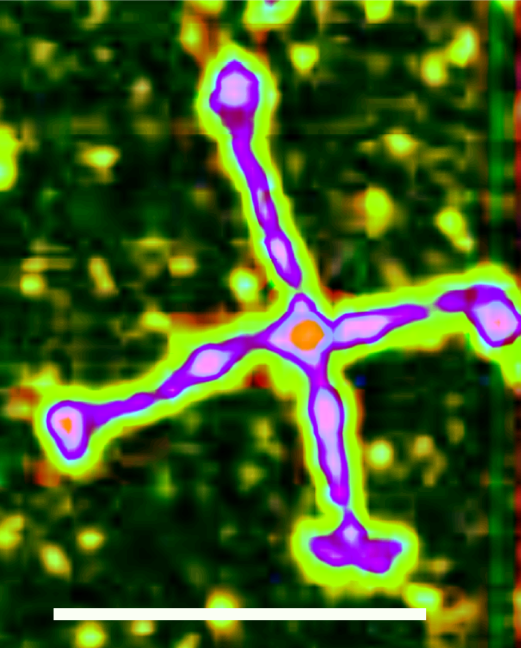
The test today is the unsharp mask filter in GIMP.  I do like the ease with which the sliders can be manipulated with instant preview updates….  i don’t much like the actual “typing” from the number pad into the slider.  But using the surfactant protein D images (that I have used from published papers (in this case those shown here are some good and not so good images from Arroyo et al  (AFM of surfactant protein D).  Regardless of the original image quality, GIMP (open source image processing software) does a great job of masking.

Pay special attention to the small masked areas in the collagen like domain of each of the SP-D trimers….  yep…. 3 to 4 small peaks beside the glycosylation peak, especially nice in lower right image, and in that one and the lower left image… a tiny peak on the side of the N termini peaks is a new little peak (of which i am trying to determine the relative incidence).  Error bars are what i have used for measurments and are visible, most are 100nm but the tiny one is 20nm, and lower center has no error bar.


Verge of a Dream: Last year

With the blinds
Half open, the office
Is cool, in the after
Noon. There is
Little money now,
Less than even
Last year.
At least the
Fair is coming
A day, a night
With twirled candy.
I’ll drive, no I
Will, the conversation
Has not changed
Since last year.
I wonder why
The flag’s at
Half mast where
The school’ll be
Empty for a month
Or more. I hope the
Aproned gal will serve
The lunch just
The same as
Last year.

RLB 05-30-2021

Come on Kroger – that wasn’t an orange you sold me.

Come on Kroger – that wasn’t an orange you sold me.  NOT FUNNY.  This naval orange was as big as a softball (really bigger) hard as a rock, the orange skin was nicely died an even orange but was so tough it was nigh impossible to peel. The inside fruit had no flavor and the segments did not separate.  Conclusion. Your produce managers grew up in a food desert, no concept of what fruit tastes like, but only willing to make money passing off hard woody long storage dyed fruit as something that we are supposed to eat.

You say to me…. what gives you the right to judge fruit. I will tell you.  I grew up in southern california with orange, lime, lemon trees in the back yard, loquat, pomegranate and apricots by the jillions in the neighborhood kid’s yard that we shared on a regular basis while enjoying the sun and outdoor games.  Frequent trips to the orchards eating cherries right off the tree, and avocados as nice and as ripe as any i have found in the store.

Kroger may be the biggest grocer in the world, but it has become the largest “fake food” grocer as well.  Shame on you.

BTW the last seed(less) watermellon you sold me was also a piece of unripe hard bitter junk.  Does a corporation have a moral commitment to its consumers.  I think so, you obviously do not.  Bad on you Kroger.

Beautiful SP-D image

This image (original from supplement of Arroyo et al) was first a screen print, then in gwyddion i added a 10px gaussian blur, then stretch color range >175 to 255.  This virtually eliminated background, but at the same time decreased the height of the various peaks.  The upside is that there is a rotational “look” to each of the trimeric arms, and there is also the hint of the tiny proximate peak to the N termini which shows up just before the large glycosylation peak on each trimer.  Clearly too are the small rhythmic peaks along the collagen like domain (almost always 3 or 4 in descending prominence and width).  One can rule out any bumping and noise since all these dodecamers fall at different directions and so scan lines are an annoyance but contribute to peak height on a random basis. CRD are show as multi-lumpy units.  Looks like the alleged glycosylation peak is present on all four trimers pretty equally.


-Perfect view of what I think will pan out is shown in the lowest arm (vertical hexamer) which shows the Nterm, the tiny adjacent peak, the glycosylation peak, three peaks along the collagen like domain and the neck and CRD in a raindrop shape.  Pretty awesome.


Tone curve in corel photo paint: I dont think it is possible to erase the data

Doesnt seem to matter much what processing happens to these images. The data remain abundantly clear for SP-D dodecamers. N termini, glycosylation peaks and three small peaks in the collagen like domain and nice CRD.  At this point: it doesn’t matter the direction, or the lines in the AFM, the image processing, or the angles between the trimers — it looks like three small peaks in the collagen like domain. Over and over again they show up.  See tone curve graph in bottom image. SP-D imagesaved and processed from Arroyo et al.

Image processing is fun sometimes: POSTERIZE

Image processing is fun sometimes with good results.  This is “posterize” after other manipulations like gaussian blur and HSL and BCI adjustments.  CorelPhotopaint19 processed images just for pleasure provide the same data as the routine microscopic (approved more or less) processing algorithms.

It is easy to see the intense brightness of the glycosylation sites (not always 100 percent in all the molecules (presumably the most intense when all three molecules in the trimer are glycosylated, but visible in a lesser amount where maybe one or two are) but so nicely shown adjacent to the N termini junctions.  The CRD are just great, and the very consistent peaks in the collagen like domain of each trimeric arm just are verified.

Whats missing here are the tiny peaks on each of the four trimers small and very close to the N- peak.  Enjoy. (thanks to arroyo et al, as usual)


Photoshop 6 vs photoshop 2021: looks like no difference

Image processing is helpful in interpreting some types of photos.  It doesn’t seem to be of much help with traditional TEM at all, in terms of sharpening or moderating the images outside of some very basic hue/saturation/lightness options, basic contrast, and getting rid of some pieces of dust dirt or previous labels.  Shadow cast and negative stained image with TEM are a little bit of a different story and some processing can help, but the biggest place that I see processing images (not the big and aggressive processing like masks and segmentation and counting objects) to remove pixelation, or increase the readability of LUT plots, is in AFM.

One sort of sad thing is that companies that are the best at using unique algorithms for manipulating raster images are also very expensive, and have invasive (in you face computer antics to which i can attest from the recent owners of CorelDRAW and of Photoshop 2021) and may not provide much if any improvement from the old programs which one typically has on disc.

In trying to determine the number of  brightness peaks in the trimeric arms of SP-D I began to feel guilty about using imaging programs that were 10 years old and decided to compare image processing outcomes of newer versions of the two programs i use most often (CorelDRAW and Photoshop).  In this endeavor I also tried the processing of ImageJ and Gwyddion and found that they are not really preferable to the general run of the mill old versions of CorelDRAW and Photoshop.  Image here compares an original photoshop 6 (easily 10 years old) and photoshop 2021 (a subscription) (the same processing was used for both images  (the original image of SP-D derived from a screen print of Arroyo et al, as mentioned countless times now).  Photoshop 6 on the left (green plot lines) Photoshop 2021 on the right (red plot lines), and arms 1 and 2 digitized in ImageJ and each similar arm (as arm 1 (left) and arm 2 (right) plots superimposed. The processing in this case was the same in both photoshop versions, that was  image adjustment>HSL (with hue not changed, saturation-25 and lightness -40)(written as HS-25L-40).

Bar maker from the original image was kept with each figure (and was reported in this image as being equivalent to 20nm). Diameter of each dodecamer digitized in ImageJ and touches the outer most edge of 3 of the 4 dodecamers (in this particular image things were pretty tidy and all four CRD to come close to the circumference of the circle, but this is not usually the case). Background is in set of plots on right.

Segmented line tracings of each hexamer began thusly: arm 1, most left portion to the right hand (near center horizontal) arm 2, begin top slightly right of center and descend to bottom of the hexamer.  This can be checked by the peak that has two close bumps on the left side of the vertical plot where two very close bright spots can be seen.

The objective of this whole exercise is still to determine how many peaks are in the area of the collagen domain between the alleged glycosylation site and the neck+CRD. Hopefully along with that information is some reasonable insight into what processing programs are easy cheap and sufficient, and what algorithms enhance the data without changing it.

Original screen print from supp Fig 4 is here.

Comparison of LUT plots with different image processing programs

Comparison of LUT plots with different image processing programs has morphed out of my desire to determine how many peaks are along the collagen-like domain of SP-D dodecamers.

I have used half a dozen or more processing programs and many many variations on blurs and medians and sharpens and masks and there is great consensus in the shape of the LUT plots so it is pretty easy to suggest that what looks nice, when compared to an original plot is pretty much going to reflect what is actually present in the image.  Case in point in the figure below where an image (screen print from the actual manuscript (oft used Arroyo et al) processed in coreldraw x5 vs photoshop 2021 really show astounding similarity. The differences in the peak heights are a result of HSL and contrast maniuplations but this doesnt change the data. Diameter of the dodecamers is in inches derived from the original images, and must be reasured against the original bar marker dimensions of 20nm given in the original publifcation (0.69 inches relative to the 5.22 here) making the diameter of this particular dodecamer around 150nm.