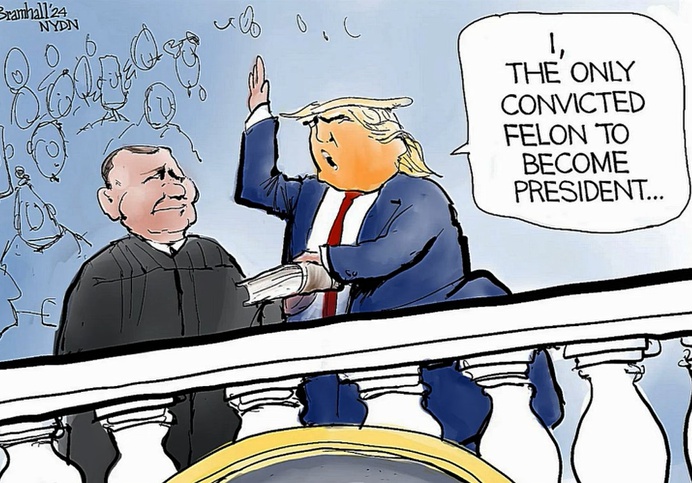
I, the only convicted felon to become president…..
yes this cartoonist got it right….
I, the only convicted felon to become president…..
yes this cartoonist got it right….
Kroger — haha, here is a real employee quote…..
When asking about the price on a loaf of 8 grain LaBrea bread (which is typically 50 c cheaper than other loaves of LaBrea bread) and whether the price had gone up or if this was a mis-priced item. All were the same price. This woman I asked, I have certainly asked at least 4 times before, the same question.
facts
1: bread had not gone up, but was mis-marked
When I said, why is the price on this bread wrong, she said and I quote “all the prices are different so we have to mark them all the same” literally what she said. I said, that makes no sense. If the prices are all different, then they need to be marked according to their real price. Why are you marking them the same.
her response, and I quote “So we can be “fast”
WHAT THE HECK…. THis is an unbelieveable thing that employees are being pushed to do, or decided themselves it is the easy button. Is anyone at home upstairs, how can this be a way to run a business. Kroger, in my opinion, is cheating, low class, deceitful, and likely unkind to employes or is hiring people who take kroger business matters into their own hands.
Thomas Arthur Turner, music, Tongue Tied, writen in about 1938 or sometime around there. Dad wrote the lyrics and melody, someone set it to music (my parents mentioned that they paid someone to do that, neither mom nor dad knew how to notate music). The first page of this sheet music survived for 90 years, but in the interim one page was lost. I remember as a child knowing the part that was lost. I reconstructed it to the best of my ability, and sent both the exising sheet music and audio (from playing piano, recorded on my phone of the missing piece).
I had a huge difficulty getting Tunescribers to figure out how to put the two together….. but ultimately they managed to make this performance video (the hands had to be removed since the original performance video was so slow as to be laughable). This performance (without hands) is almost like the sheet music.
My audio part just sounds like garbage, not really because i remembered and played garbage, but difficulties in putting the two together occurred… — it took two months to arrive as something that remotely sounds like the piece dad wrote, — i had to ask them to REDO it, and play the sheet music with the chords too big to play except as an arpeggion (they just left some notes out), and to please hold the tied notes, (they played the tied notes twice (which cancelled out the syncopation that I know dad liked), and to please play the song a tempo (i didn’t mention the tempo for them to use, and they played it like a durge in the first performance video).
But this video is close to the tempo I play the piece. I had to laugh that sometimes there are no keys greyed out when there are lots of notes being heard….. so i think this technology (and the technicians) are not quite up to “tempo” not to make a bad pun.
At this point, i am quite sure that i am the only one who cares about dad’s music anyway…LOL. so i am not pressing for a second re-d0.
Tongue tied performance video….. a song composed by my dad, for my mom.
MP4 of Tongue tied.
“To me, the most beautiful word – and I’ve said this for the last couple of weeks – in the dictionary today and any is the word tariff,” said Trump. “It’s more beautiful than love, it’s more beautiful than anything. It’s the most beautiful word.”
says Trump…. good grief
“I am your retribution” (beginning campaign remarks)
“9 guns pointed at her face” (ending campaign remarks)
I hope not.
It is so annoying to have some converstion going and have the bot say, “wait an hour” ha ha.. or “come back in 24 hours”. I have no personal interest in asking these bots anything except in a research context, particularly about peaks and surfactant protein D. I wanted to see whether the AI could be unbiased about whether there were x number of peaks, or more or less, and come up with a number which I have spent 5 years trying to figure out.
Both kept coming back with detailed instructions for me on how i sould use image filters, and which programs, and signal processing, and which apps…. so nothing really new there.
The answer so far is, uploading hires images is out of the question for either bot, asking it to draw or indicate on the image where the peaks are, is also out of the question, asking CoPilot to please count peaks in an .csv file (anything more than just a few rows and a couple columns is out of the question. I did get an interesting formula for excel for taking the mean of ten rows — along a column of more than 2000 rows and it came back with a pretty good simulation of the original plot.
So adding AI to plot counts is just not going to happen in the next little while, since image resources on both bots are limited (i dont think i have been targeted…LOL).. and both just keeps coming up with solutions for finding “brightness peaks” along plots, and analyzing those plots that have been suggested by colleagues, friends and my two programmer kids. So it really has not been much of a help.
In addition, it is really annoying when it quotes data from “my own work” LOL, I guess I could have put into the chat…. do not include any data from >>>>>> me>>> . All in all, i dont think it helped much.
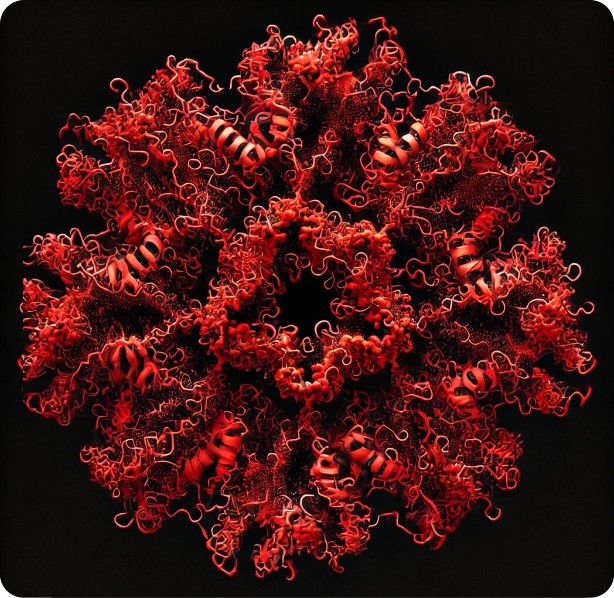
I havnt had so much fun in days, nor been so frustrated (LOL). I thought maybe I could use chatGPT or CoPilot to verify the number of peaks along a hexamer of SP-D, but there were a lot of barriers. In the process of asking the former to tell me how many bright spots were encountered in a tracing of an SP-D hexamer (a process which the first few encounters proved really interesting, i got this lovely image, and then silence and block. It was “sweet” to provide me with code for python, but that is not what I had hoped to get. But i felt this image was so beautiful, though so NOT what i asked for, that i would post it as a great mistake in my communicating what i wanted to a bot in sufficient detail.
It is so pretty that i thought i might turn it into some kind of cross stitch pattern, or perhaps a stained glass pattern. Certainly this is a great printable image for christmas tree ornaments or window clings. Who would have guessed.
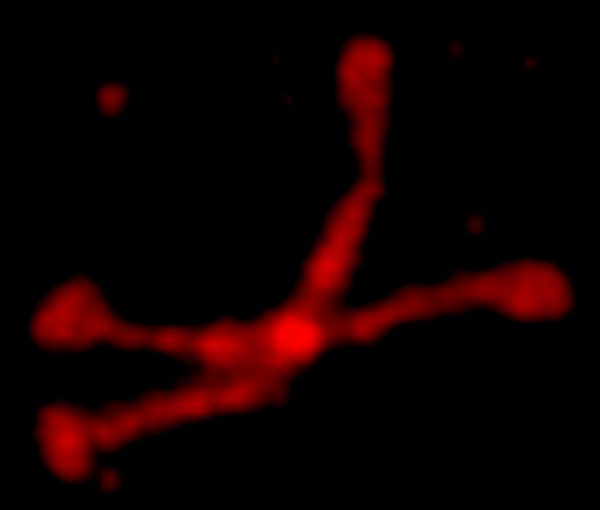
I went to RCSB to look again at the molecular model of the neck and carbohydrate recognition domains of SP-D, it is possible that data from there were translated into my gwyddion filtered (dodecamer, gaussian blur 10px, limit-range 100-255) image.
The actual image used is shown below this “whatever it is”
I find it interesting how peak finding apps and programs (in this case an xlsx function) differ from what I count. There are variations in what the apps find and in what i count as well. This is all just a dive into what is the “best way” to count grayscale (brightness) peaks along a plot from an AFM micrograph. At this point, it is still up to the researcher to make determinations. I dont see a single app that does what “i think” is right, and I dont do what “i think” is right all the time either.
It might appear that the more measures the better the outcome, kind of like “crowd sourcing”. When querried, “Exploratory data analysis is a technique data scientists use to identify patterns and trends in a data set. They can also use it to determine relationships among samples in a population, validate assumptions, test hypotheses and find missing data points.” So there you have it, just exploratory.
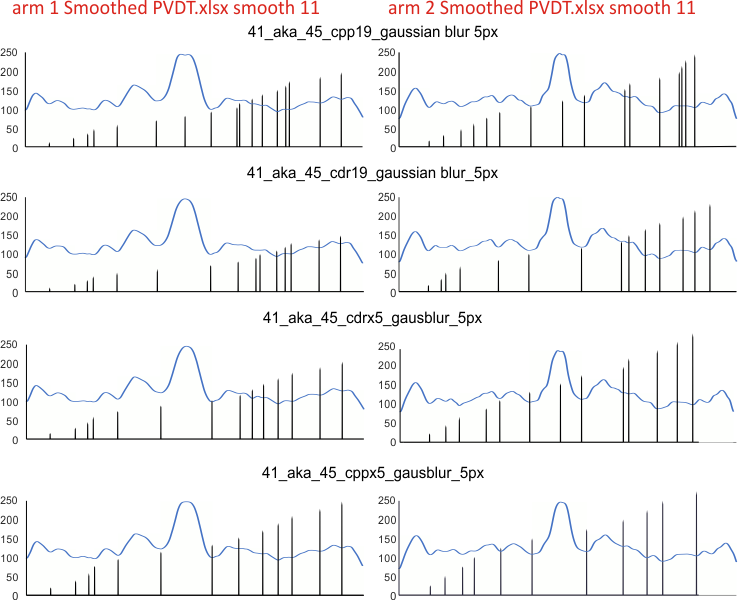
Case in point, variations below in my counts, mostly identical, yet slightly different plots from image in different programs produce different results in the PVDT.xlsx program, just small, and then there are my erros in judgement too. More assessments may mean a more accurate outcome.
Graphs for peaks found below: ONE surfactant protein D dodecamer, as TWO hexamer arms (15 peaks per hexamer)(found as the mean from 1000 plots) divided in the middle, mirrorred, into FOUR trimers with the center peak as the tallest widest peak. Top image has the PVDT program for detection of peak divisions, and the colors in those divisions are my choices as to the identity of the 15 peaks.
The name of the program which applied the 5 pixel gaussian blur is given: cpp19=corel photopaint 19; cdr19=coreldraw 19; cppx5=coreldraw x5; cdrx5=coreldraw x5. Differences are slight, and one must keep in mind that there is a separate trace through each hexamer for each arm and for each program. This is more likely the cause of differences, than differences in the way each program executes its gaussian blur. Each was traced with a 1 pixel line using ImageJ. Each was exported with the same y axis to .csv, then opened and plotted in excel. Diagrams were made using CorelDRAWx5.
I did a similar assessment of the same SP-D dodecamer using the Octave function iPeak. Find those data here.
I need to redo two of the plots for the second hexamer (arm 2) … I did redo a couple of them once to see why the last peak on arm 2 wasnt detected. I know it was bothersome.
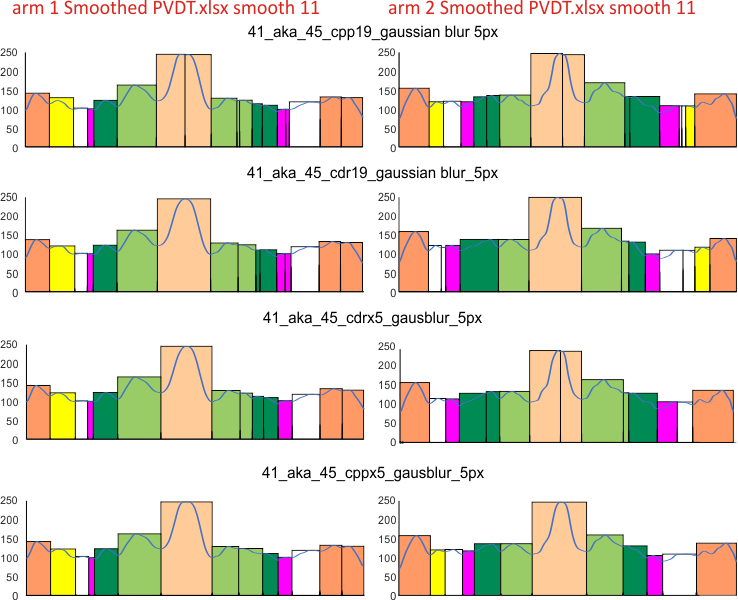
Center peak(s) peach color=N term joined peak, composed of all four N term domains; light green peak(s), glycosylation peak(s); orange peak(s) at the ends of both hexamers, CRD that account for the known 5 peaks per hexamer. All other peaks routinely found bring the more realistic peak count to 15 per hexamer. These are color coded, but consistenly not found in the literature as “real” entities though clearly they are.
i really do not like chiggers, sorry