JD Vance on “stay with your abusive partner” I DONT THINK SO

JDVance on “stay with your abusive partner” I DONT THINK SO!!!

That would have cost my daughter her life, and possibly her two girl as well. Her current partner was violent, attacked her with a knife but didn’t kill her. Should she be told to stay with him, i think not, and he went to prison.  JD Vance knows zero about biology, gender role playing, gender violence, and zero about abuse, and is just talking from a hypercritical, uneducated and unknowledgeable position.  Dont listen to it women, and girls, if the male is abusive, get yourself out of there, and get help. Pattern below.
Gender is a behavioral issue.
male female stained glass pattern

What is “Undesirable” is up to me to decide (referring to digital signal processing)

This is an interesting term to apply to digital signal processing. What (to me at least) suggests is that these different statistical approaches do little to change the data, but they impose personal “hopeful” results.  This is a direct quote from a very nice opinion paper on digital signal processing, but it just made me understand that the human brain, at this point, is still largely responsible for outcomes of those processing procedures.

Statistics and probability are used in Digital Signal Processing to characterize signals and the processes that generate them. For example, a primary use of DSP is to reduce interference, noise, and other undesirable components in acquired data. These may be an inherent part of the signal being measured,…

I am not saying that digital signal processing is not useful for helping to shape views about what signals (in this case, which peaks) are worth “recognizing as important” and those which are seen as “undesirable“, but the bottom line is still “it is ultimately my choice” and my application of the metrics used in that digital processing that ultimately “I accept”.

So I am not sure why so much credibility is given to these methods over the (yes laborious) task of “thinking” rather than just accepting what the apps put out.
This concept has been brewing for a long time, “the good the bad and the learned” which title i should change to “the good, the bad, and the undesirable” perhaps (LOL), and I have been trying to sort out how much “bias” i add to these apps as i work to find the number of peaks along a trimer (as height, width and valley data).

It seems that the question of the benefit of trying to be diligent at using algorithms for peak determination along a trimer of surfactant protein-D (at least at this point in time) is perhaps not that helpful (save a fairly robust verification that I see just a little more than what the peak finding apps see). I dont think this is heubris, I really think that at this point in time, the nuances of bilateral symmetry and huge differences in peak widths, heights, and peak positions along a plot are pretty much neglected (undesirable and overlooked) in the peak finding apps used so far  (scipy, octave -iPeak.m, AutoFindPeaksPlot.m, Lag-Threshold-Interference, PeakValleyDetectionTemplate.xlsx, PeakDetectionTemplate.xlsx, and others, using various settings (all these apps have been mentioned hundreds of times in this blog).

I am using those digital processing data, along with what i see as peak patterns as a blend for a final choice for peak parameters (yes that’s bias)(bias is a dirty word for ‘learned’).

A quote from the same article mentioned above “…… the final judge of quality is often a subjective human evaluation, rather than an objective criteria. These special characteristics have made image processing a distinct subgroup within DSP” (aside,  i think he should have used the singlar of criteria (criterion) here).

Upcycled? who is in charge of marketing at Kroger?

Kroger sells Seeded, Multigrain bread….  they call it upcycled… good grief, does that mean it is made from discarded grains, perhaps goat, chicken and pig food that is in the trough they dont want to throw away.  UPCYCLED?  I need to know a whole lot more about where this stuff comes from than what is provided on their label, especially since what goes into their “non upcycled bread” often has questionable food value”.
In particular since the word “discarded” is in the meaning of upcycled (see below), that would be important and detailed information to give the consumer, providing a chance to make a rational choice about whether the “discarded grains” came from a reasonable source.
In addition, so are the words, “of greater value”, in the definition of UPCYCLED, and the only thing that i saw (or tasted) in Kroger upcycled bread was the  greater price.  LOL. At least two dollars a loaf more expensive then what I consider the best 8 grain artisan delicious bread on the shelves…. La Brea’s 8 grain bread which here is Cincinnati is 3.99 a loaf….  Kroger upcycled (and up priced) is 5.99 a loaf, and just (in my opinion) their UPCYCLED bread tastes no different than any other kroger, spongy, bread and it still has taste of emulsifiers and dough conditioners. Out of five, this bread gets less than 1


UPCYCLED is defined as follows:

(of discarded objects or material) reused in such a way as to create a product of higher quality or value than the original.
“upcyled furniture”

Peak finding comparison, iPeakM10-80, vs my peak finding

I have been trying to find a app for finding peaks that does not depend upon previous peak height and width to influence the peaks following, and the peaks prior to extremely large peaks. I have also tried to find such a app that “understands” symmetry.

What I would like is one that has 0 “influence” and 0 “width” parameters. I find peaks consistently that are very small, and always in a similar place (which for two or more years I have named the “tiny” peak, that lies in the valley between the N term peak and the glycosylation peak(s) of surfactant protein D. I have rarely found that the peak finding apps (this includes scipy, octave, excel templates, stackoverflow) find those peaks with any regularity, in spite of the fact that they very often find “peaks” that I would never assume would be a peak.

I have used the same .csv file of two plots (each a hexamer, thus two trimers) of a dodecamer of surfactant protein D and applied several iterations of Octave iPeakM. The counts below are for peaks per trimer (the N term is included in each trimer though it is a central peak in this molecule, and is included in the count only once in each hexamer). (as an aside, it is interesting that this central N term peak often has divisions, as is seen in one plot, but not the other).

Peak widths for all the Octave plots are determine without my influence. The most botton plot, is MY ORIGINAL PLOT, from before I ever started using Octave or any other peak finding app. Thus something between iPeakM60-80 was/is the best (but not perfect) match for my own findings.  Coloration of the peaks is done for the sake of observing obvious symmetry, the N term peak (peach) the glycosylation peaks (light green) and the CRD peaks (orange) are known (and reported peaks). Four additional peaks are consistently found per trimer. Five additional peaks (total of 8, counting the N term in a trimer) in each trimer is the typical number of peaks found. (that data obtained from almost 1000 plots of trimers previously).

Verge of a Dream: I call your name

In a voice so soft
I call your name
Soft as in
a last breath
on earth.
But with
better
Loves today
No answer comes
Back from you.
A voice so deep
carrying
Her name through
Walls and windows
everywhere though
She, unawakened
by it
As the sound
makes its
Way unstopped
To where
she rests with
Only staff and
mandolin
on the desert floor.
At the end
Of your calling
By herself
But not alone
With the gifts
of
art she
Made
and gave
to others
today.
Her eyes are
Blue stars on
the sky in its
Most dark.
Of your own hand
It will not matter
Asking if your
empty guess will
Be the maze’s end
That is
not one unclear
to her.
And won’t even
become
a slight
Smile on the
lips or be
Enough to,
When tomorrow,
Again
you try
To appeal
For any help or
answer.

RLB, 07/06/2024

Jumbo and Jackass

Jumbo and Jackass – the sad political animosity

I wonder when we can learn that neither side is good nor bad we just need to get together and find common solutions. Is that concept just “dead”.

democrats republicans elephant donkey

SP-D poster images

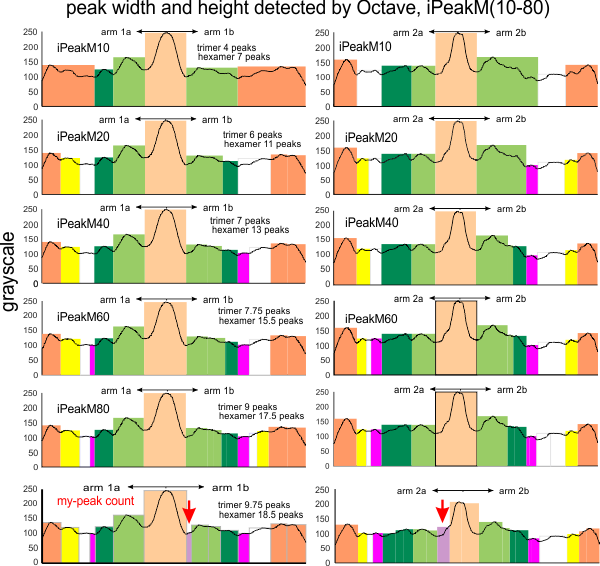
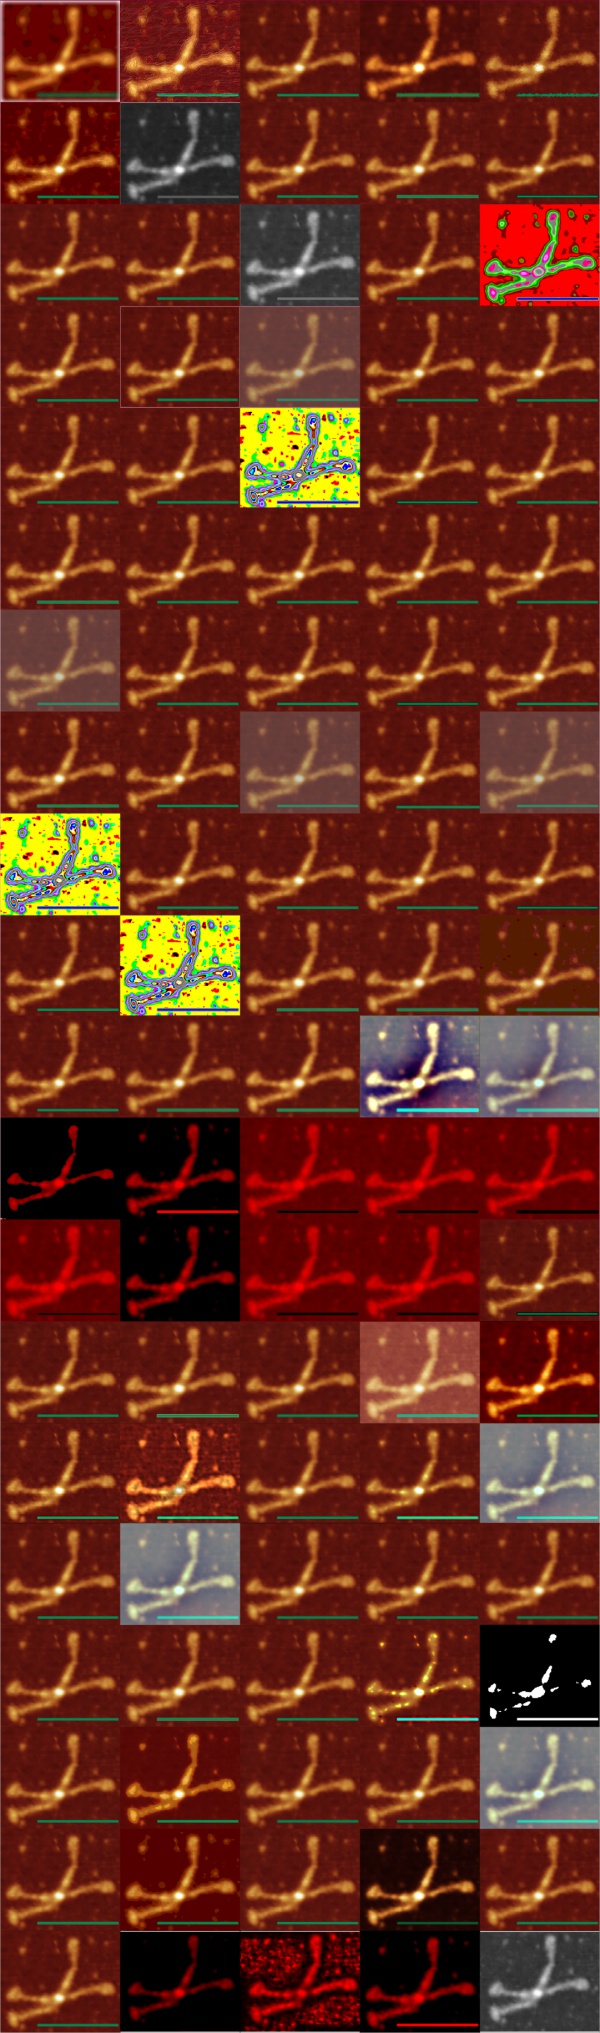
The image below is the result of a test of whether the image filters available in various free and paid programs made much of a difference in the detection of brightness peaks (incidence, height, valley, width). The answer, it seemed to me, was that a rational application of many filters did very little to change the raw image, and even after radical filtering, such  as “posterizing” (red and yellow images below)  conveyed the same SP-D structure.

Programs used to score image filtering ranged from  “paid” Photoshop 2021, CorelDRAW 19 (also with the built-in raster editing program of the latter), older purchased Photoshop (6) and CorelDRAW (x5)(also with a raster editing program), and “free” programs with image filters such as ImageJ, Gwyddion, Inkscape, GIMP, and Paint, as well as several image filtering options in “free” Octave.  Below are samples of all of the above for checked uniformity in their individual application of filtering algorithms, using a single dodecamer as a test photo.

That photo was derived from a screen print from Arroyo, et al. Easily identified are the N term junction of the four trimers (bright center*), just lateral to that the glycosylation site (each of the four trimers shows some degree of brightness*, there are at lest three bright peaks found lateral to the glycosylation peak (as of now, not named and with no known function but highly repeatable peaks are found in literally hundreds of plots of dodecamers and separately as trimers), and on the ends of the trimers, the carbohydrate recognition domains*..  which typically have several peaks combined (which is consistent with that domain being modeled on RCSB as three flexible and floppy  globular formations. Just before the CRD domain peaks,  is the neck domain, which may or not be visible as a “peak” depending upon how the molecule is arranged during processing. (nb, the * denotes known peaks).

One image filter (Gwyddion, image presentation filter) (center image bottom row) probably does the best job of maximizing the appearance of bright spots (peaks).

The three posterized yellow images were used to test (using the same settings) whether various programs would produce identical results, which actually did appear to be true. The reasoning behind this test was that the old Adobe Photoshop 6, well outdated, but free and easy to use, was compared with the same filters in the paid version of Photoshop 2021. Similarly, CorelDRAW x5, also old, was no different in application of imaging filters with the same settings as CorelDRAW 19.  This opens opportunity for reliable image filtering to be had from existing, familiar and free programs with easy to use formats.

Image Filters and programs (out of the sample of 100 in the image below) that will continue to be used for peak finding are:

1: no processing (as a control)
2: Gaussian blur (2px, 5px (10px in one extremely pixelated image)(CorelDRAW, Photoshop)
3: Limit range 100-255 (Gwyddion)
4: Gaussian blur plus 250 highpass (Photoshop)
5: Gaussian blur plus 50-50-50 unsharp mask (Photoshop)
6: Median filter 10px (Photoshop)

This turns out to be 6 imaging filters, and 6 signal processing functions to be applied to peak finding.