Monthly Archives: October 2020

How to bug your brand loyal customers — CorelDRAW

I have used CorelDRAW (and early on it was Kodak which had  WordPerfect within) since its inception.  I did not come by my first copy legally, that I regret, in fact someone presented CorelDRAW 3 to me on 11 pink 3.25 inch floppy discs.  I treasured that program, and purchased legally, versions 4, 6, 10, 13, 15 and 19, and encouraged others to purchase it as well. So clearly it was good for them. With CorelDRAW 19 there was a huge change in all aspects of their business that I have come to detest.

The early product (s) which included WordPerfect were wonderful, and they reached out to embrace and be compatible with the stiff-necked and unfriendly Adobe and Microsoft products. I could pretty much convert whatever i did in them back to what the university of cincincinnati demanded that we use.  Those early days, Word was terrible.

Now i am so disappointed in the way CorelDRAW abandoned their philosophy – i wont purchase another copy, and i cannot get rid of the dumb-ass popups that appear (after having forced me to lose some of the functions in x5 (which I now know as the sign that if i dont close it, it will crash).   What a terrible step backward by a wonderful company, backward into the world of commonality. It is sad.  Whats more, the aggressive image, too cartoonish, fearmongering (just like our contemporary society), certainly meant to provoke anxiety (deliberate mind washing) in this really badly designed popup is enough to make one wonder if there are any individuals with civility working there at all.  Shame on you CorelDRAW.

Estimating DMBT1 using adjacent SP-D image

Review:Surfactant protein-D and pulmonary host defense Erika C Crouch, crediting John Heuser for this quick-freeze deep-etch image (no bar marker). Respir Res 2000, 1:93–108.
From hundreds of measurements from several published papers, different authors, and using their unprocessed images and ImageJ the estimated arm length of the SP-D in the image below is 128nm, and from that the arm length of DMBT1 is about 192nm.
Four imageJ LUT plots below. The SP-D has recognizable peaks, especially N termini on the left and CRD on the right, even in this etched micrograph. The adjacent image of DMBT1 (same micrograph) shows much less easily defined peaks. Background plot for the image is included beneath each. The irregularity of the SP-D is well known, the regularity of DMBT1 may reflect the string of scavenger receptor cysteine-rich domains. Both these molecules have been visualized by other microscopic methods (shadowing and AFM) which present a much clearer picture of what they look like.  Even this early microscopy does validate what has been found more recently.  There is an important difference in the arms of SP-D and that is the width of the arms after shadowing which are very thin in the collagen like domain, as opposed to the rest of the molecule, and also compared to the arms of DMBT1 which are many times thicker (because these two molecules are within the same field of the micrograph, one cannot explain it as experimental artifact.

Amerithon – my virtual run across America

319 miles completed. Not quite 10%, so two years + to go, just now leaving my home state of california. I enjoyed seeing places i have visited in real life, and been skiing and to which i have driven.  I also laugh when i see the terrain and know full well that i would still be struggling on the mountains, but i am really running (virtually) on much flatter, easier ground. December 1 2020, Just passed the last of the Mohave desert and heading toward Los Vegas (virtually) and a map of miles completed 470.

December 23, 2020 573 miles completed. Right here in Los Vegas (virtually). It might be kind of fun to run in and put 5.73 in the penny slots just to see if “i win”.amerithon fitness challenge


ONE – 5-8 – FOUR

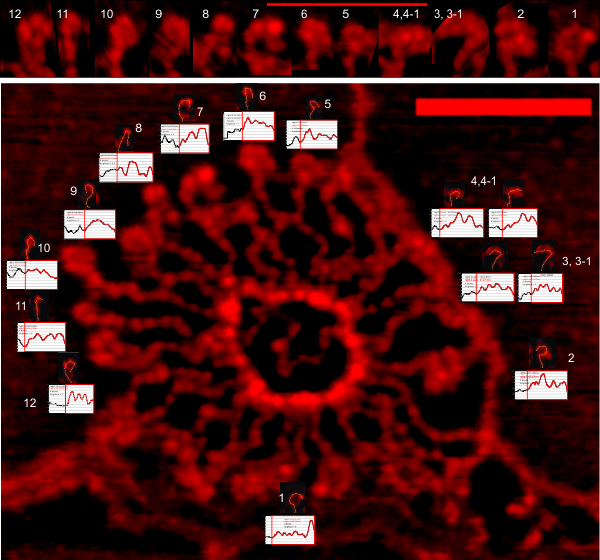
As of this minute, i am thinking that the number of peaks along the arms of the multimer under current investigation is along these lines.  One, eight, four.  That is, one (1) very bright peak (junction at the ring of all the multimer arms yielding one very bright peak), eight (5-8) regularly spaced pretty evenly sized less bright peaks (along the straighter part of the arm) and four (4) varying peaks, with one or two of the peaks being brighter than the other two, and typically the last peak being of lesser brightness than the three prior peaks, sort of a tapering off).  This has become apparent through “staring” at this molecule for several months, and processing the images in as many ways as made sense.  The easy way to count the peaks is by using this set of algorithms…  three different programs, sometimes four (photoshop, gwyddion, coreldraw, imageJ).  see image above (cropped_300ppi_psd_high_pass_250_gaussian_blur_5_px_0ther_maximum_10px-radius) and below (2Dfast fourier transform in gwyddion).  The plots are different but peaks look similar, the top image much easier to count peaks and a plot with less noise.


Concensus plot for last for peaks of multimer (hook)

This is a consensus graph (plot) made from the summary of about a dozen different segmented lines overlying peaks in the outer arm of a multimer, which i am calling the “hook” portion.  This hook is a consistent and interesting feature and it occurred to me that there might be a pattern in the position of the brightest peak in these last four peaks.  There still may be, but it is not as definite as i had hoped.  This is, keep in mind, a summary of arms from just one multimer.  plots peaks are approximate, but the trend in rising peak heights is consistent.  The total arm length including this hook portion is something around 100nm, but yet to be confirmed. The description of how the images was processed is found here.

The purpose of singling out the hook was to try to find a common point from which to measure the straighter portion of the multimer arms and determine whether there is a repeating periodicity to the brightness peaks there.  It appears that a point just AFTER the four peaks in the hook might provide a good place to begin that search. It is disappointing not to have found a consistently, brightest peak.

Last 4 brightness peaks of a ring multimer arm: is there a pattern?

An image provided to me to “look over” is in fact a wonderful gift (non-tangible, unexplainable, artistic, important).  I have spent a couple months trying to decipher what this protein actually might have as a consistent shape in its numerous arms. So i decided to look at one place where I thought i could tell there was a pattern in brightness peaks, and that was the “hook” at the end of each multimer.

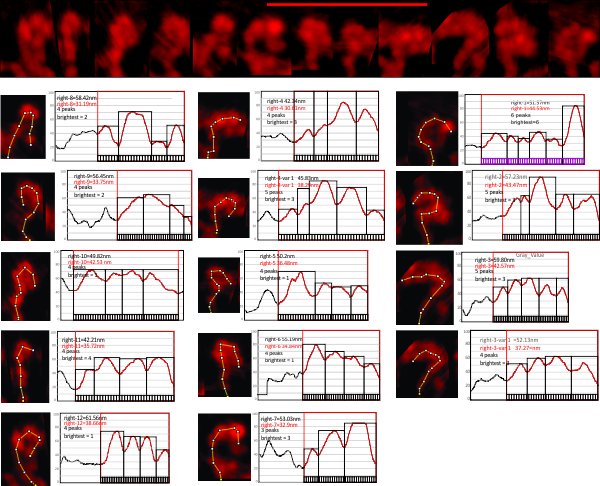
image below has had the “hooks” cropped out of the original image (which stands as i have named it –round_1_orig_cropped_300ppi_psd_high_pass_250_gaussian_blur_5_px_limit_range_100-255 which means that it is the original image, increased to 300ppi in photoshop, and then to it applied a 250 high pass filter, then a gaussian blur of 5px, saved, then opened in gwyddion and in the latter, a limit ranger algorithm for basic operations>limit range (100-2555) applied. Images were cut and rotated in corelDRAW, then exported as a single image straight line, each identified from right to left with their tracings and their plots. ImageJ was used to create the tracings (segmented line), brightness peaks (plot profile). Plots saved to excel, imported as metafiles in CorelDRAW, and the brightness peaks kept relative to 100% and the x axes as nm according to the original bar marker. Bar marker was retraced with each segmented line of a hook area.

Mean peak width (+SD) in the area plotted in the red box with the plot line in red  (n=14, 36.5nm + 4.39); mean number of peaks in a hook (n=14, 4.2 + .69); right to left, the width of peak 1 (n=14, 9.5nm + 2.7); width of peak 2 (n=14, 7.28n + 2.4); width of peak 3 (n=14, 8.85 + 2.4); width of peak 4 (n=13, 8.30nm + 2.7); peak 5  (n=5, 7.2nm + 1.9);  It is possible to begin at the most right part of the tracing and count highest peak in that direction rather from left to right…. go right to left.  All tracings were done in the same direction from a portion of the molecule’s arm to the end of the hook. It is clear that a few of these have some ambiguity in where the hook hooks up to the arm…. that was a judgement call – in particular hooks labeled 1, 3 -5.  3 and 4 were traced twice.  Whether one bright peak was actually two spots was also a matter of judgement occasionally, but a 5% change in brightness was used to determine whether a peak was significant.
If i take out the duplicate of plots 3 and 4, and delete odd plot 1, then the picture is much clearer. peak number (n=11, 4.09 + 0.5); peak total hook width (n=11, 34.65 + 3.8); brightest peak  is either peak 1 or 3 (occurrence is 4 each out of n=11); peak 1 (n=11, 9.72 + 2.8); peak 2 (n=11, 7.8 +2.3); peak 3 (n=11, 9.0 + 2.44); peak 4 (n=10, 8 + 2.93); peak 5 (n=2, 8.5 + 2.5).  It looks like the brightest peak might be a little wider (obvious) and the the hook is 4 peaks.

Verge of a Dream: From an open window

From an open window,
I wanted
Warm air and sun in.
As I wake each morning
Ready to swim
Your suit worn
As though it was skin
The same old thing
You making art
And me hoping for
a word
with a ring.

Time won’t be
banked, moving
as it does, unreined.
And the same
old thing, forgetting
whether you don’t want
this or
don’t know
that you do.
Moving ahead,
a mind grinding its
way through
as it must to
find water below
thick ice without
an augur for spring.

It is for some, a beginning
and others ending
what was and would be
the same
old thing.

rlb 10/2/2020