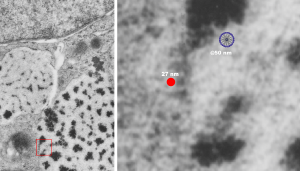
Here is a comparison, a diagram of what might be an SP-A fuzzy ball at something like 47-50 nm, and a nearby ribosome @27 or so nm. The image on left, shows inset box from the granule in this alveolar type II cell from which the inset is derived. My diagram isn’t exact, but it might be close. These images are from guinea pig (now famous) 301.
Category Archives: Electron microgaphs of lung
Are these fuzzy balls surfactant protein A or SP-D?
There is one guinea pig in this group of animals that was completely different, in the sense that all the surfactant granules within alveolar type II cells in this animal are just overpowering all other cytoplasmic elements. This was a control animal which makes for interesting speculation, maybe even an oblique reference to the fact that this structure is a response to environmental influence (in this case probably a massive pulmonary infection or immune disorder. At least there was no experimental reason for alveolar type II cells to display so many granules.
Posted previously are images of an interesting variation on the granules, those which, in between the 100 nm layering pattern that is most prominent, some fuzzy rounded ball-like groups of protein exist. A previous post that mentions these structures, in that case they were given a dimension of 50-60 nm… here I measured them more like 49 nm… so basically the same. I was wondering at that time if they were surfactant protein A or not. I am wondering now if they might be surfactant protein D. Well, still leaning toward SP-A, in a configuration that would be two molecules “deep” or half the width of the banding seen in the granules.
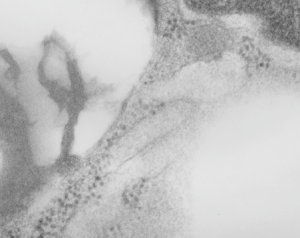
I did find this reference from Crouch et al, 1994 which had rat SP-D images that were awesome, however the dimensions don’t quite fit… and they give 46 nm as the size for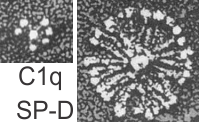 a single arm of the SP-D molecule, and that is exactly half of what I measure as the full diameter of one of these dense structures diameter (47 nm). They calibrated their microscope well, I am not arguing with their final dimensions. From their paper are two screen shots C1q (left) and SP-D (right). The magnification is not given in a micron marker bar, but C1q is just a little smaller than SP-A, there fore if the relative magnifications are the same in these two, then that makes SP-D about twice as big as SP-A would be so maybe 50 microns which sort of contradicts the size given. If C1q has a spread of the CRD close to SP-A (which is 20-20 nm) and picture on left is 20-30 nm diameter, then it appears that the SP-D here is about 2.5 times larger than SP-A would be and that is more like 70 nm or even 100 nm, and a previous post on this blog calculated the round SP-D at 100
 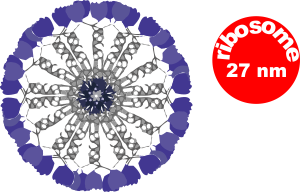 nm. I am opting for the fuzzy balls in the granules of alveolar type II cells in this study to be SP-A. Per diagram.
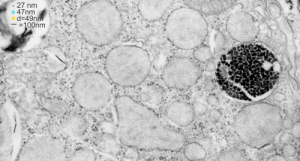
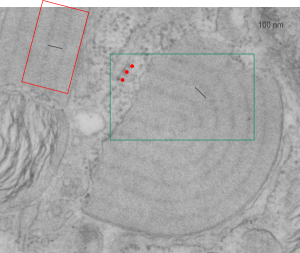
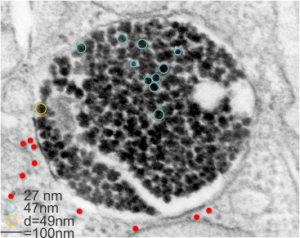
The image below (9124_17082_gpig_301_alveolar type II cell with granules, lamellar body (upper left under the legend) and a fuzzy all inclusion (in the RER i believe). I saw these fuzzy balls embedded within granules but this is the only time I saw a cluster of them as a separate granule. Image below show the fuzzy balls clustered on the right, the figure below that shows relative sizes of ribosomes (red dots of 27 nm) and some examples of the diameter of the fuzzy balls at something around 47 nm and an optimally sectioned fuzzy ball (greatest diameter) of almost 50 nm.
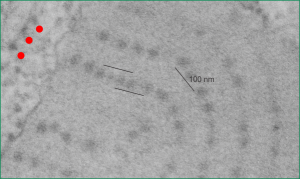
These fuzzy balls can occur, per above comments, within the granules which are otherwise typically without these spherical densities. micrograph 9864_17085_gpig_301. The red dots on right are more or less equivalent to 27 nm diameter (ribosome size) and the red bar is therefore equivalent to 100 nm. Because of the lack of prominent layering and the added width (red bar) for the periods, it is presumed that this represents a tangential cut, and the size of the electron dense round balls (blue circles in images on right) is something around 47 nm (which is similar to estimates in other micrographs based on the size of a ribosome. So these fuzzy balls can be seen both as separate membrane bound entities or found between the period layers of granules. Unretouched photo on the left, photo on the right has the end-on single circular profiles highlighted…. looking like bulls-eyes. 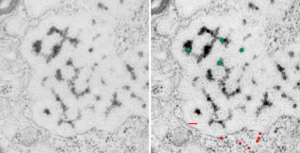
What do fixation and staining do
Methods of fixation and staining allow ultrastructural components of each cell type to be preserved and resolved differently. Glutaraldehyde based, non-coagulant-fixatives encourage direct cross-links with amines and other nucleophiles, most notably lysine and arginine, and cause deformation of the alpha-helix structures in proteins. Paraformaldehyde cross-links basic amino acid lysine, as well. Osmium tetroxide, in these studies was always used as a secondary fixative, except for beagle dog, where it was used as a primary fixative, helps to preserve lipids, and cross-links at unsaturated sites in membrane lipids and nucleophiles like amino and sulfhydryl groups. Osmium tetroxide enhances overall electron density of the specimen, adding contrast. Contrast is further enhanced by positive staining with heavy metal salts (uranyl acetate, enhancing lipids, nucleoproteins and proteins) and lead citrate (enhancing the contrast of proteins, membranes and glycogen) (Frankl, 2015; wikipedia). These all fit well with the type of layering (electron dense banding) found in alveolar type II cell granules.
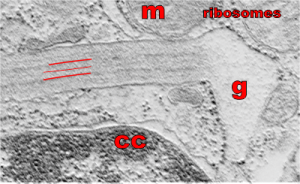
So what electron density in the structure of the alveolar type II cell reveal about the molecular structure of the layered protein. Well, surfactant protein A (and D also) has helical regions, probably hopefully the less dense central layers have a lot of lysine and sulfhydryl groups. This might fit well with surfactant protein A patterning. Three red lines = 2 outer dense layers and less dense central layer; m=mitochondrion; ribosomes are the black dots (nucleoprotein staining with uranyl acetate), especially situated on the electron lucent racket end of the granule; cc= condensed nuclear chromatin (nucleoprotein staining with uranyl acetate), in the rounded portion of nucleus in the lower left corner of the micrograph. This image was shadowed with an exact replica, 68% transparency, and a few pixels to right and lower than bottom image. one of my favorite electron micrographs of these alveolar type II cell granules .
Does alveolar type II cell granule exit at the apical plasmalemma?
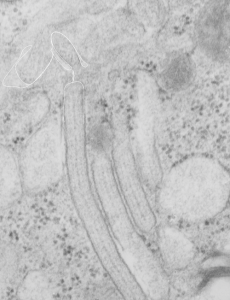
The highly ordered protein granule in the alveolar type II cell of some species doesn’t not often show any signs of where it “goes” in the cytoplasm, whether to exit at the apical plasmalemma or whether only to be dumped into the lamellar body to exit the apical plasmalemma with immature surfactant that the lamellar body holds. This is probably an image of the closest encounter I have seen between a granule and the apical membrane, and it is not complete, nor definitive at all, but just a reminder of the fact that the issue remains unresolved. See here four granules, the one on the left is very close to the apical membrane. There is a white line around a nearby apical membrane fold (typically called a microvillus, but certainly not a rigid one) and the bracket denotes the space between the former and the latter — close at best, but not a membrane fusion and release.
Banding is clearly evident within the granule. Sadly, the back of this micrograph is labeled “duplicate” but i cannot find the original with the description of negative number, block number animal number and species, but it will be either guinea pig or ferret.
 Just for comparison, here is a close encounter of granules with a lamellar body, which is actually a fairly frequent event. Lamellar bodies on left upper and lower right. three angled structures are granules (you can see the linear banding in the center one.
100 nm square = alveolar type II cell granule pattern
A summary and diagram – two years in the making (not so LOL)
A protein granule exists in the rough endoplasmic reticulum of alveolar type II cells of some species which has remained relatively obscure. It has characteristics of a highly self-associated protein with a predictable repeating substructure and displays at least 8 prominent patterns:
1) most commonly it appears as a layered sheet about 100 nm thick
2) which upon cross section comprises two dense outer layers, 100 nm apart, a less dense central layer which can have up to 3 faint layers on either side. This pattern forms one period
3) the layered sheet (100 nm-thick period) can also be stacked many times creating a granule with a length and height of many microns
4) whether single or highly stacked, ribosomes only lie on growing ends of the granule and in opportune cuts a single period has 4 ribosomes, 1 at each dense layer and one on either side of the central layer
5) the perimeter of the granule could be linear, or rounded, with sheets (layers) arranged in patterns reminiscent of flow extrusion, where each of the 4 ribosomes equates to a die, and as if the rate of protein translation/modification, and the shape, size and press capacity of the ER determined if the granule would be gently curved or U shape, looped or folded-back, concentric, or branched. Some granules were a mixture of all these forms, even rarely intersecting
6) Both the outer dense, and less dense central layers appeared to be continuous on perpendicular cuts, but clearly punctate when cut tangentially
7) Outer dense bands showed a periodicity of about 4 per 100 nm, while less dense central bands showed a periodicity of about 5-7 per 100 nm, possibly lined up in a staggered format
8) A faint vertical tie was also seen at about 4 per 100 nm beginning typically at one of the densities
Measurements have been made but these are approximations derived from hundreds of micrographs and numerous publications. Similarly, measurements by numerous reports on the size and structure of surfactant protein A have shown that it is likely to be an 18-mer with a spread of the CRD at the top of the bouquet of something on the order of 25 nm. It doesn’t take a big leap to put four 18-mers together vertically and copy them side to side to come out with a pretty awesome banding pattern that fits the 100 nm dimensions.
Single period alveolar type II cell granule: end-on
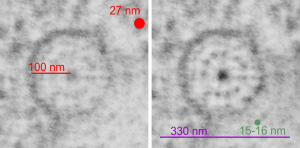
Electron micrograph of an alveolar type Ii cell which is overrun with surfactant protein granules and an isolated part of a larger granule shows this profile which is so symmetrical as to look like the spokes of a wheel. Micrograph on left is unretouched, micrograph on the right is burned in the areas of periodicity of the molecules of surfactant protein, and dodged in the areas between, just slightly to highlight what I saw.
The purpose of the study is still to determine which of the surfactant proteins is responsible for forming the granules. So here is such a single period of a granule which has a ribosome marked for approximate size (red dot=27 nm) red bar=100 nm superimposed on an electron micrograph (unretouched). Right hand image has emphasized image, and a circumference of the round less-dense inner band of the period (central dense dot represents the “outer dense band” seen in linear profiles. The inner dots have been counted in linear granules at closer to 5-6 per 100 nm but here there are 11 or 12 dots of the less dense central band under the circumference, which is about 330 nm, or a little less, and in this photo the dots measure about 15-17 nm (consistent with previous measurements, then are spaced at about 25 nm apart. Not everything lines up exactly with previous posts on this subject in the linear profiles, but clearly they are analogous and match pretty well. The spoke appearance likely corresponds to the vertical lineup of molecules seen in granules that have a linear arrangement. (just as an aside, there is something spooky about the fact that I have found several times now that the space between these molecules in the central less dense band are spaced apart the same distance as a ribosome…. that is just uncanny, and I bet it will end up meaning something about protein synthesis in general–just a heads up). see this post and this post
Desmosomal – mitochondrial associations
For at least three decades I have seen these associations, some more clearly defined, others not so clearly defined (like this example) of mitochondria that show cytoplasmic filaments adjacent, and in very close proximity to the plasmalemma, and to that of an adjacent cell.
This particular mitochondrion (M) is in an alveolar type II cell from a guinea pig lung and the desmosome is very indistinct but still clearly visible and the cell adjacent is very likely an alveolar type I cell due to its thinness.
I reported these in an obscure journal sometime in the 1980s, desmosome-mitochondria-associations as a cursory report, and then never did anything with it. (aside: I do remember contacting some pathologist for information and to see if he had seen anything like this reported before…three months later, before i finished this paper, i saw his publication on this topic…. i learned a valuable lesson from this, not a negative one, but if one has to protect one’s ideas, then that must show that one doesn’t have that many.. i just accepted this theft). So now I am returning to many micrographs (about 20k) and gradually finding examples of all the desomosomal – mitochondrial associations like this, to assess the frequency, the reason, and just add some general knowledge on the complex.
Red dot=approximate diameter of a ribosome to translate into 27 nm as a scale marker, M=mitochondrion, the very faint dotted circle has within the increased density between the mitochondrion and the very faint desmosome. Photo has not been enhanced to show the desmosomal-mitochondrial connection. 10236 M8060 guinea pig alveolar type II cells.
Guinea pig alveolar type II cell granule protein: surfactant protein A?
Guinea pig alveolar type II cell granule protein: surfactant protein A?
There are so many images which show the same data, layering, periodicities, hexagonal array at the growing ends of granules that the evidence that these are some regular sort of structure in select species is a little hard to ignore. I keep trying to convince myself that I am seeing what I think I am seeing. This opportune section of an alveolar type II cell (from ferret) granule is just kind of nice, as it shows the growing end ribosomes, the stiffness of the RER profile when the protein begins to organize (seen on the left hand side of the micrograph) the looseness at the growing end before further oligomerization takes place in the granule (right hand side of the micrograph) where it seems that there is some kind of organization soon after the protein leaves the ribosomes (like the hexagonal pattern for a top down view of surfactant protein A, as seen here (unretouched EXCEPT for the burn tool in photoshop to highlight what I have seen), though I would have liked to see more with the central dot. Ribosomes were burned to highlight, and a ribosome marker (nominal 27 nm) are given plus a bar marker at approximately 100 nm, and hexagons at the growing end of the granule are burned as well. Inset is enlarged from white box in top figure. 9835_17084_guinea_pig_#301
More on two levels of periodicity in alveolar type II cell granules: guinea pig
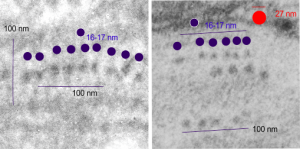
Below are some examples of an alveolar type II cell granule in an electron micrograph from a guinea pig lung which I am showing unretouched, and then enlarged, and same image with periodicity enhanced with the burn tool in photoshop, enlarged again and nanometer markers included in each increased magnification.
From the four figures below, it seems that the relative size difference in the periodicities and the number per nanometer is similar with dog.
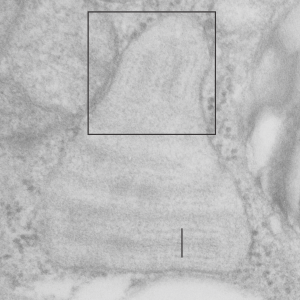
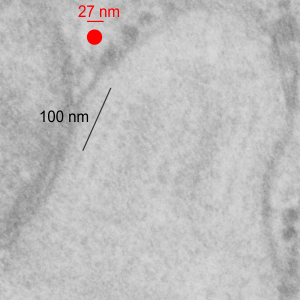
Fig 1 (top) is from a guinea pig alveolar type II cell. Bar = 100 nm. Box is an area enlarged to become Fig 2, seen just below Fig. 1, which is an unretouched electron micrograph of a single granule. It is easy to see the periodicity in the outer dark band and the lighter central band is different. This view is just a slightly tangential cut to the long axis of the granule. Figures 1-part of 5 are from 9835_17084_gpig_anm#301.
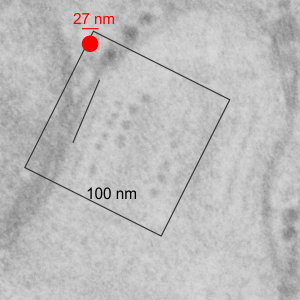
Fig. 3 shows the same image as Fig. 2, except that I have burned the densities (periodicities) in the middle less dense band (smaller dots) and the outer dense band (larger dots) so they are more clearly visible.
And in Fig. 4, the box indicated in Fig. 3 is rotated to show the periodicities and nanometer marks from a ribosome, the whole band-period of 100 nm, the periodicity and approximate diameter of the proteins comprising the smaller dots (approximately 15-17 nm in diameter seen as the purple dots), at about 5-6 dots per 100 nm, per the bar marker.
The next figure (Fig 5.) compares guinea pig (on the right) with dog, in a similar assessment of the middle band periodicities (dog on the left). NB, the larger periodicities (from the outer dense bands of one basic period of this granule (100 nm width typically) are clearly seen in guinea pig images, but only slightly recognizable, find maybe two at most, in the image of dog.
Tangential cuts through alveolar type II cell granules show dense layer substructure
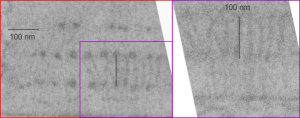
Tangential cuts through alveolar type II cell granules show dense outer layers of this regularly arranged molecular substructure, has a periodicity to it, albeit densities of a different size than at other sites in the , just like the less dense middle band of these granules. Images below also show a slight tendency for vertical banding, within the horizontal layers of the surfactant protein (A ? ) granule. The hierarchy for all the level of substructural organization are here:
- 100 nm period (height) (no restriction on length of granule seen) which has 1,3,5 or 7 layers between the outer dense bands
- Outer dense layers on perpendicular cut look continuous, on tangential cut however, they show a periodicity with large round densities about 2.5 per 100 nm length.
- Moderately dense central band shows a periodicity of 5-7 densities per 100 nm
- vertical stripes, a kind of banding, perpendicular to the long orientation of mos that coinciding with the periodicity of the central dense band.
