Category Archives: Mitochondria: electron microscopy

odd mitochondira, great mitochondria, electron microscopy and ultrastructural details

Desmosome-mitochondrial tethering: just what I see

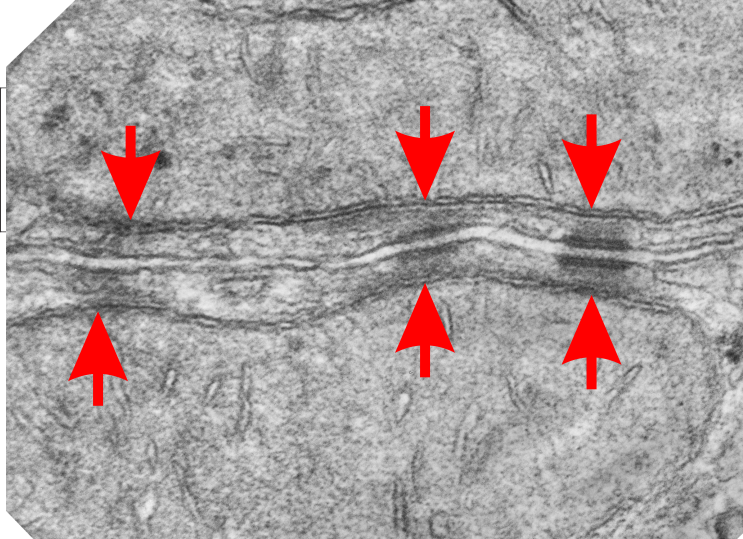
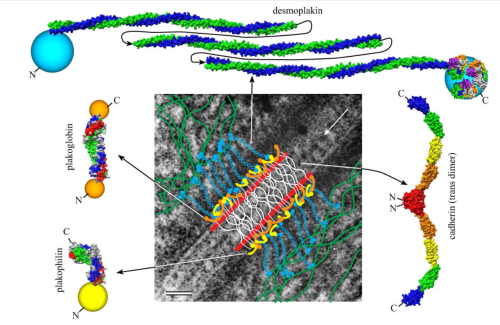
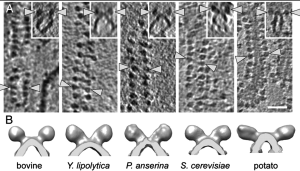
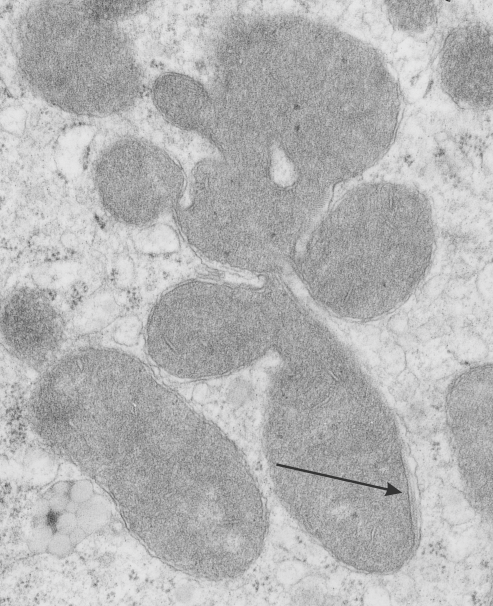
I found this particular electron micrograph which has two mitochondria and a desmosome in pretty good orientation to look at any periodicities or patterning in the substructure. It seemed to me that the central line of the desmosome, and the cadherin molecules which create it and the links to the plasmalemma (which have been modeled with molecular models) could fit best as a “sprint” type association.  Those of you who are old enough to remember the plastic hair combs that looked like wishbones arranged in parallel that one could use to sort of tie up a pony tail, will recognize this flexible structure.  I found, or should say “think i found” a similar type of density in the cadherin molecules in the center of this desmosome (diagrammed as that side by side “wish bone” array.  Interestingly, cadherins were mentioned to one group to come in a dimer which would very easily form this springy wish bone structure….  and listed the “half wish bone” as one option as a molecular model of the desmosomal cadherins. One of those articles has a great 3D image which doesn’t look exactly like what i see, but is close found here    – and another is this title Studer, Daniel & M Humbel, Bruno & Chiquet, Matthias. (2008). Electron microscopy of high pressure frozen samples: Bridging the gap between cellular ultrastructure and atomic resolution. Histochemistry and cell biology. 130. 877-89. 10.1007/s00418-008-0500-1.
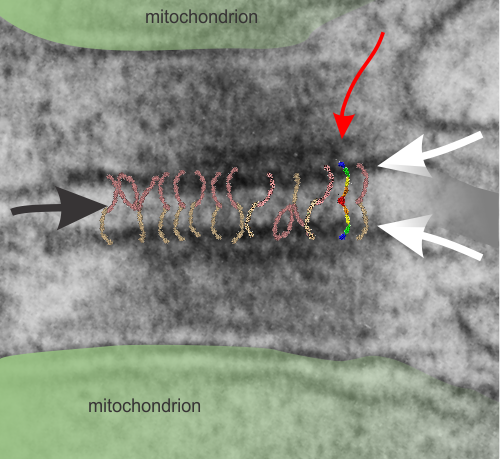
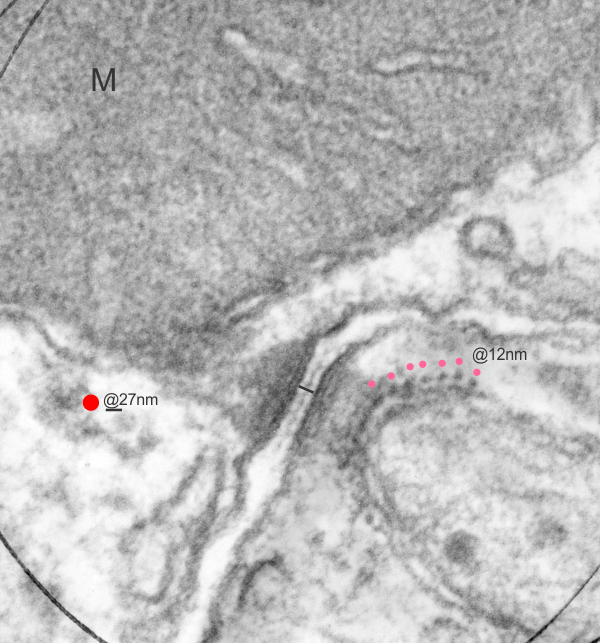
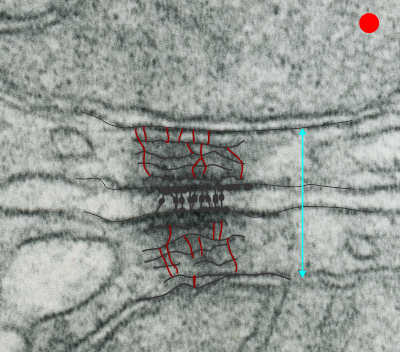
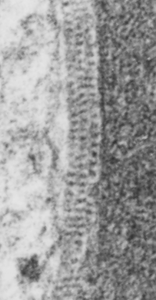
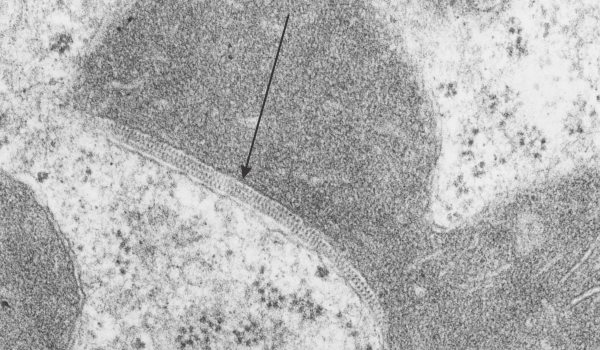
. I actually don’t like the idea of calling the arrangement “untangling desmosomal junctions with knots” as i think if they were knots….there would be no perfectly wonderful order that can easily be seen with ordinary transmission electron microscopy. It is also very appealing to have flexibility within these junctions as the wishbone (wish bone) alignment would afford…. that would be just really fun. electron microscopy mitochondria desmosome junction
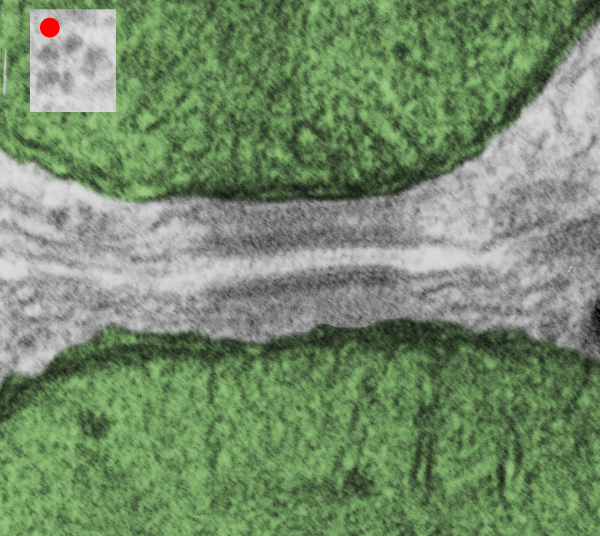
So here is the same electron micrograph as yesterdays post but the mitochondria are actually fuzzed green in a separate layer.  Red dot=a ribosome, approximately 27 nm in diameter. The absolutely regular arrangement of cadherins is seen in the middle of the desmosome…. no knots, no tangles, no mess….  just regularly spaced. This micrograph is not retouched to emphasize anything…. it is just the way it looks on the negative. The plasmalemma of the two cells is not in exact cross section and so it is fuzzed. The span between densities both on the plasmalemmal sides and the center densities of this desmosome work out to be about 1/13-14nm.  I have not put that together with any models yet and in the image below just sized the molecular structure according to the TEM, not using the actual size (just using the shape).

electron microscopy mitochondria desmosome junction
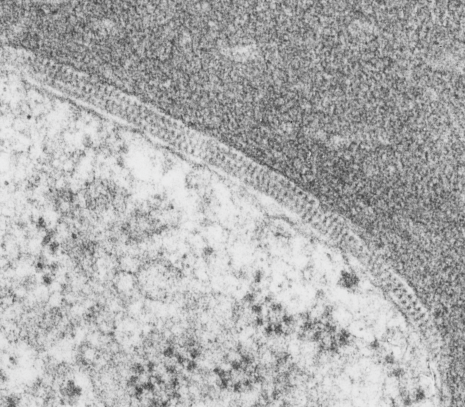
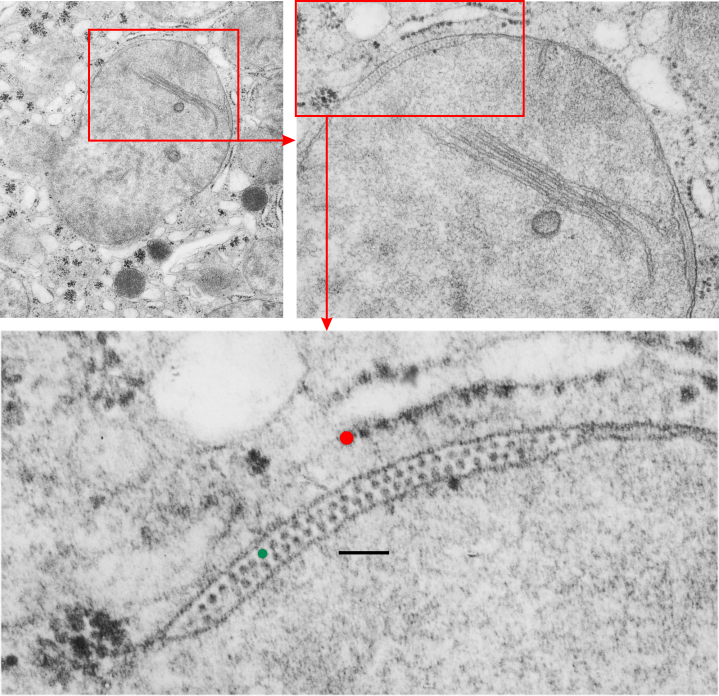
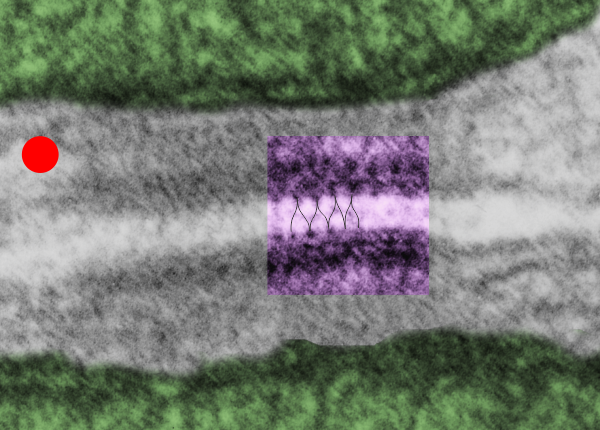
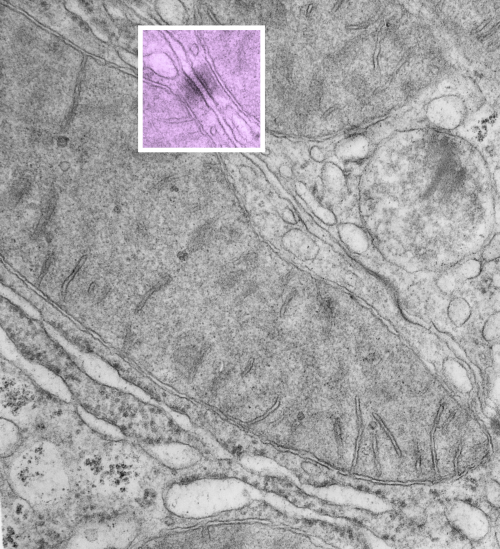
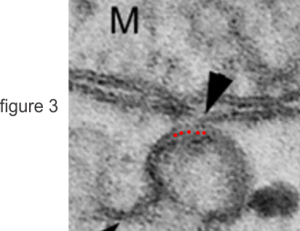
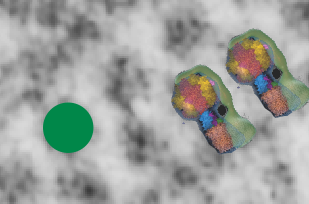
So in the second figure you can see an area that i enlarged, cut and pasted in photoshop, and enhanced in contrast and colored purple  and ADDED what i think are the lines of the wishbone arrangements of the cadherins.  Densities (increased in contrast here) work out to about 1 for every 13-14nm.

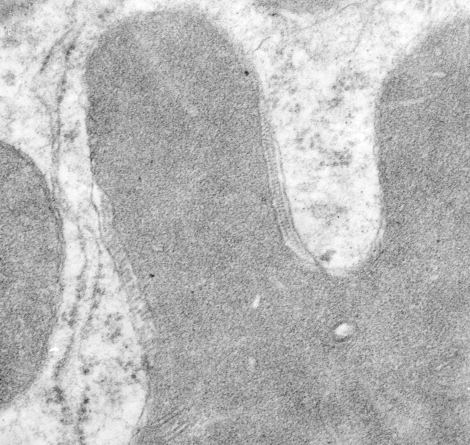
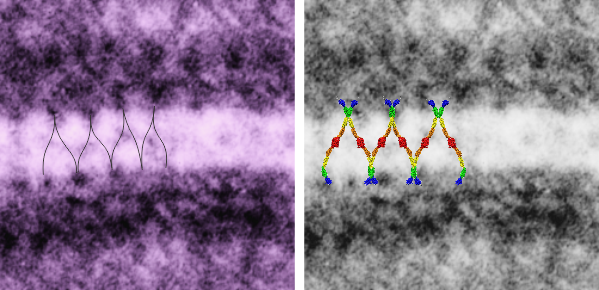
Into two enlargements (one the purple box above and another with the molecular model of a cadherin dimer, copied and mirrorred, fit really nicely into what might be a flexible, stretchy springy type portion of the desmosome.  Just a thought….  ??

electron microscopy mitochondria desmosome junction
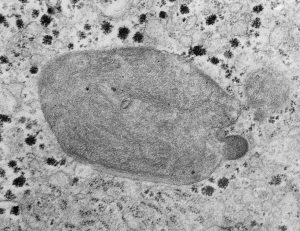
6110_5080_mouse_f_liver_36,200x_4x


Cadherin molecules overlying a desomosome – mitochondrial tethering

I don’t know much about desmosomes, but they do make unique junctions with nuclear pore intermediate filaments and also very definite connections with mitochondria. The mitochondria – intermediate filament connections with desmosomes show a couple nice ultrastructural changes from the routine: 1) the mitochondrial outer membrane is flattened, or straightened in the area of connection with the intermediate filaments over the desmosome, and it is also a little darker. and 2) the mitochondrial body itself is drawn towards (at least that is the way it looks… as if there was a dragging force) the desmosomal intermediate filaments. The central line of the desmosome is not always visible when i see these tethers (often with two mitochondria in adjacent cells and a single desmosome, but there are molecular models of the cadherins (several) that I cut pasted masked and reduced to fit in the appropriate intercellular space where they would appear. It is a good lesson is relative “size” and “shape”.

Micrograph: Pale green semitransparent mask is over two mitochondria, one each in two adjacent cells. Red arrow points to the inner dense layer (maybe i will add the known proteins there “in scale), the white arrows point to the plasmalemma of the two separate cells, the black arrow points to the center dense “knotted” region, (maybe i will measure distances between visible knots) and the molecules (several taken from the internet, look similar and were pasted into the intercellular region (see demarcation from right hand side transparent grey.

Triple desmosomal mitochondrial tethers

Both sides of two adjacent hepatocytes show two mitochondria each linking to three desmosomes.  Nice to see such symmetry and the implications are quite amazing, in that whatever is happening at the plasmalemmae of these cells is happening “together”, really nice intracellular communication.  Red arrows point to the inner mitochondrial membrane, just above where the intermediate filaments of the desmosomes approach the outer mitochondrial membrane.  I wish i could say that I saw some cross sections of intermediate filaments here, but i didn’t.  The double desmosomal mitochondrial junction on the left is more tangential than the one on the right.  The pair in the middle is intermediate.

three desmosomes two mitochondria six mitochondrial-desmosomal junctions

Intermediate filaments tethering desmosomes and mitochondria

I have mentioned this phenomenon before but i keep finding images which speak to the prevalence of mitochondria (in this image two mitochondria are tethered to a single desmosome, one each in two adjacent cells). in addition to the fun double tether here, look at the “spots” which round the corner of the smaller mitochondrion…. tiny dots of what I measured as about 12nm, but the intermediate filament on cross section is 8-10nm, therefore my guess is that these wre cross sections of intermediate filaments. I did enhance these dots in any way except to change the contrast of the lower half of the image using photoshop.  The dots ” cross section of evenly spaced intermediate filaments” are very prominent on their own.  Pink dots are proximate to the filament x-sections, the red dot is an approximate ribosomal diameter.  30nm bar in middle is about what the desmosome measures, oriented perpendicular to the two plasmalemmae. N 6105 Block 5080 Mouse, female, orig mag 36000

Mouse hepatocyte: mitochondrial desmosomal connections

https://www.ncbi.nlm.nih.gov/pmc/articles/PMC2211412/pdf/nihms34115.pdfI have marveled at the mitochondria and their propensity to connect with both desmosomes and nuclear pore filaments. These little “bridges” in density and substructure connect them very often. Here is an hepatocyte sample just to show the point. Boxed area has mitochondria in one hepatocyte and mitochondrion in adjacent hepatocyte bridged by a desmosome on both sides.  There is great “order to the connection, first a lucent band (disk) then a dense and then a less dense, then a more dense and one more lucent band with little periodicities and a very dense and then lucent band and the plasmalemma.  So this is a total of 10-11 gradations in electron density  x 2, one on each side of the space between the hepatocytes, and within that space is of course the density pattern therin that is typical for desmosomes. The rigidity of the desmosomal “disk” or “round weld” is quite noticeable, on the plasmalemma side and the mitochondrial membrane side, and the thickness of the whole complex (from the membrane of the mitochondrion in one cell to the membrane in the adjacent cell is pretty fixed as well. I am pretty sure if you search PubMED you will find at least two publications where I mention this phenomenon. I don’t know why it has received so little attention.

This particular mitochondrion also has another connection with a desmosome about half a micron distal to this site.

Making just a line diagram over top of the desmosome-mithcondrial connection i used just lines. Below that is a real great diagram of a desmosome with link to the publication. Ribosome=about 27nm depicted as a red dot. Blue arrow is about 200nm.s

Manuscript was by DL Stokes.

Patterns or artifacts: SER and outer mitochondrial membrane

I just love it when I can see patterns in electron micrographs. I am not saying that there are not patterns in globs, and bumps and lines etc that appear as artifacts of fixation, of course they do, that is part of the nature of this particular process of inquiry. All methodologies have them, this one, that is the denaturing and folding and dis-alignment of molecules seen in aldehyde (or any) fixation, belongs to microscopy.  BUT WHEN i can see repetition in an orderly pattern as in these red dots, then i think, OK there is an underlying organization of the proteins (whether by fixation made lumpy or round or whatever), there is organization.  The authors that created this image have looked at mitochondrial-RER and SER interfaces and given reason to believe that there is a transport of Ca+ back and forth using SERCA 1 (sarco/endoplasmic reticulum Ca2+-ATPase 1s). They don’t mention the regular areas of protein denaturation here, but I think it would be highly possible that it relate to some aspect of the SER membrane proteins coming in close contact with outer mitochondrial membrane.  I added the red dots, just below actual dots in the micrograph,  highlighting the symmetry of spacing and size. Whether this relates to their fixation, or stain, their negative resolution or a structural organization on the SER i don’t know (the overall grain density of this micrograph is similar to the spot size), but it caught my attention. Their figure below is from —  Leopoldo de Meis , Luisa A. Ketzer, Rodrigo Madeiro da Costa, Ivone Rosa de Andrade, Marlene Benchimol . Fusion of the Endoplasmic Reticulum and Mitochondrial Outer Membrane in Rats Brown Adipose Tissue: Activation of Thermogenesis by Ca2+. PLOS One Published: March 2, 2010

Desmosomal-mitochondrial associations

The physical proximity of mitochondria to filaments in the cytoplasm has interested me for a long time. Particularly, those associations between mitochondria and the cytokeratin filaments (tonofilaments, intermediate filaments) on the cytoplasmic side of desmosomes and the associations between mitochondria and nuclear pore filaments (those projecting from the cytoplasmic face of the pore into the cytoplasm). Anchoring plaque proteins and central proteins are pretty nice in this electron micrograph which wikipedia describes thusly: “transmembrane linker proteins, called desmoglein and desmocollin, belong to the cadherin family of cell-adhesion molecules bind to plakoglobin and other proteins in the plaques and extend into the intercellular space, where they interact, forming an interlocking network that binds two cells together”.

I have hundreds of examples of these interactions, the former being more numerous in some cell types, the other more numerous in others. Here is an electron micrograph of one particularly nice association between a mitochondrion and a desmosome.  There can be mitochondria on both sides of a desmosome as sectioned in 2D, which begs the question of the 3D aspects of these associations.

electron micrograph of mitochondrion associated with desmosome

In fact, a single mitochondrion can be associated with more than one desmosome, and can also touch on the cytoplasmic-side-filaments of more than one nuclear pore.  M, mitochondrion, arrow, desmosome, bar= 100nm dot is 27 nm by ribosome. Mouse liver female control C4.


Mitochondrial cristi: what is this ordered protein

Mitochondria from vinyl chloride exposed animals have been posted on this blog before. HERE and HERE. I have made the assumption (no proof what-so-ever) that this just seems a perfect match for ATPsynthase.  Here is another example of such a mitochondrion, also showing the highly organized repeating pattern found in the intra-cristal-space of mitochondria from other liver electron micrographs from guinea pigs treated with vinyl chloride.  Amazing similarity. THis waits for someone else to confirm, but in the meantime when I see the images, I will post. Someone out there will know.  So here is a mitochondrion with such a cristi, and below that is someone elses micrograph (publication site linked) which shows the spiral repeating structure of ATPsynthase.


REF
One of their figures (not pictured here) shows about 16 dimers per 200 nm = 1 per 12.5 nm. When I measured the ribosome at 27 nm in my image (to the left) of intra-cristi structures, then there were about 19 densities per 200 nm.  So the numbers don’t add up too well.  Particularly with one of their figures copied above where their measurement (white bar in the figures and insets above) is noted in their publication to be 50 nm. This is quite far off what I see in the intra-cristi space in the figure to the left. It also seems clear that they have a propensity to be found in these groups between the outer and inner mitochondrial membranes and less frequently on the inner cristi.

Intra-cristae – membrane protein organized in mitochondria

Intracristae – membrane protein organized in mitochondria — found in guinea pig liver electron micrographs in a retrospective study on vinyl chloride (and air) and vitamin C exposure from the 1980s. These cristae with apparent organizations of ATP synthase in a long row, parallel and sometimes looking staggered, sometimes aligned, have appeared in exposed as well as control (both groups receiving vitamin C). This is an awesome image with a 3-layered row of highly organized molecules looking a little like they are strung together somehow, yet each distinct. Just marvel at the order in the completely UNRETOUCHED electron micrograph  of a mitochondrion in guinea pig liver here.

4158_M8011_guinea_pig_liver_VC_vitC_HRMitochondria in both control and experimental data sets have mitochondria with wild shapes, very atypical for mitochondria in general, in some cases on section looking like asterisks (yep, same type outer membrane configuration seen in apoptotic cells). This is the case of the mitochondrion shown enlarged (the scalloped edges are just cropped so the ATP synthase is more visible. Image below 5924_17010_guinea_pig_air_vitC_liver.

As with the intracisternal body in the alveolar type II cell of the lung of many guinea pigs, when the protein within the cisternae of the RER begins to assume a substructure (in that case, a layered granule), then the resulting RER becomes very rigid looking.  Similarly here, when the cristae have the ATP synthase all aligned in alternating double rows, the intramitochondrial membrane and other elements in the mitochondria also take on a rigid appearance.

5924_17010_guinea_pig_air_vitC_liverMicrograph below shows a section of an example of odd shaped mitochondrion with an area of extended ATP synthase molecules head to head, and on the inner mitochondrial membrane a little bit of rigidity and a thickening of the membrane is seen (arrow).

3548_M7991_guinea_pig_air_vitC_liverHere is a mitochondrion with an extended section of rigidity in the mitochondria membrane adjacent to a TRIPLE row of ATP synthase molecules, lucky cut (I hope that is what this is), and again rigidity in the mitochondrial membranes in this zone, and inner mitochondrial membrane has a slightly increased electron density about it (which of course means something, but I don’t know what).

4158_M8011_guinea_pig_liver_VC_vitC
HERE is a nice article…. it says the protein is in the matrix, which is not what is seen in the micrographs above, it is in cristae…. so there is some explaining to do on this topic.

Vinyl chloride and low Vit C exposure: guinea pig, liver, mitochondrion, intramembrane proteins

Vinyl chloride and low Vit C exposure: guinea pig, liver, mitochondrion, intramembrane, inclusions — a long title. This is an electron micrograph from the liver of guinea pig # 7 in a study about inhalation of vinyl chloride in conjunction with / without vitamin C. Dr. Martha Radike (who was a wonderful friend and colleague) did this study back in the early 1980s, but I don’t believe she ever published the results.  This particular animal (M8029) inhaled 600 ppm vinyl chloride 5 days a week for a year. The specifics of this which I cant remember (30 years ago) are 600 mmp VC, 4 hours a day, 5 days a week for a year, and this particular animal received 2-10 mg of vitamin C per day.  The mitochondria in lung, btw, were also very enlarged, though at this point I did not see any of these little inclusions within the mitochondrial membrane.

guinea_pig_liver_mitochondrion_vinyl_chloride_low_vit_CPublished reports have described changes from vinyl chloride exposure in liver: hypertrophy and hyperplasia of hepatocytes, activation and hyperplasia of sinusoidal lining cells, fibrosis of the portal tracts and the septa and intralobular perisinusoidal regions, sinusoidal dilation, and focal areas of hepatocellular degeneration. While the latter came out of a document that said DO NOT REFERENCE DO NOT QUOTE (oh well, excuse me), these are separate observations, but supportive of the unusual changes that Martha Radike (and I) found as mitochondrial changes seen in liver her year-long vinyl chloride exposure experiments in guinea pigs. There is a single mitochondrion pictured here, and two enlargements of areas (red boxes designate insets) which show the most wonderful inclusions I’ve seen twixt the outer mitochondrial membrane and inner mitochondrial membrane (I guess I could look for it in the intra-cristal membrane too but I haven’t yet). There are some misshapen mitochondria with cristae showing such in the air-breathing controls, which I will post, that received higher doses of vitamin C.  One wonders if the health of the entire colony played more into the results of all these changes (lung and liver both).

These little lollypops stuck on either side of the membrane are neatly alternating in a wonderful order and speak to something that I have not investigated but which was immediately apparent when I did googled “lollipops and inner mitochondria membrane” this may be ATP synthase. The dimensions are close to a reference I found: Structure of the mitochondrial ATP synthase by electron cryomicroscopy  by John L. Rubinstein, John E. Walker, and Richard Henderson.  There are some great videos on this molecular machine: HERE and HERE and HEREATP_synthaseIn the bottom section of the top micrographs the RED dot is @27 nm (ribosome), green dot @ 18 nm, bar marker, 100 nm. In the small bottom image i just cut and pasted two visuals of ATP synthase onto an enlarged portion of the above micrograph.  I added two charts to the pdf uploaded previously describing the materials and methods for vinyl chloride exposure. Find that document –> vinyl_chloride_vit_C_guinea_pig_lung1.

Next post is going to be a few pix of the ribosome bundle which is adjacent to some of these portions of intramitochondrial membrane with ATP synthase strings.